Turn2CCase · Registration Journey

00 / 10 Opening

Turn2C · Product Design Case study — 2026

00 / 10 — Case study

Turning
registration into
an activation journey

How Turn2C redesigned partner onboarding to reduce initial effort, surface value earlier and build a foundation for continuous improvement.

Start reading — 01 · The problem
Company
Turn2C
Role
Lead Product Designer · Discovery, UX strategy and experience coordination
Year
2026
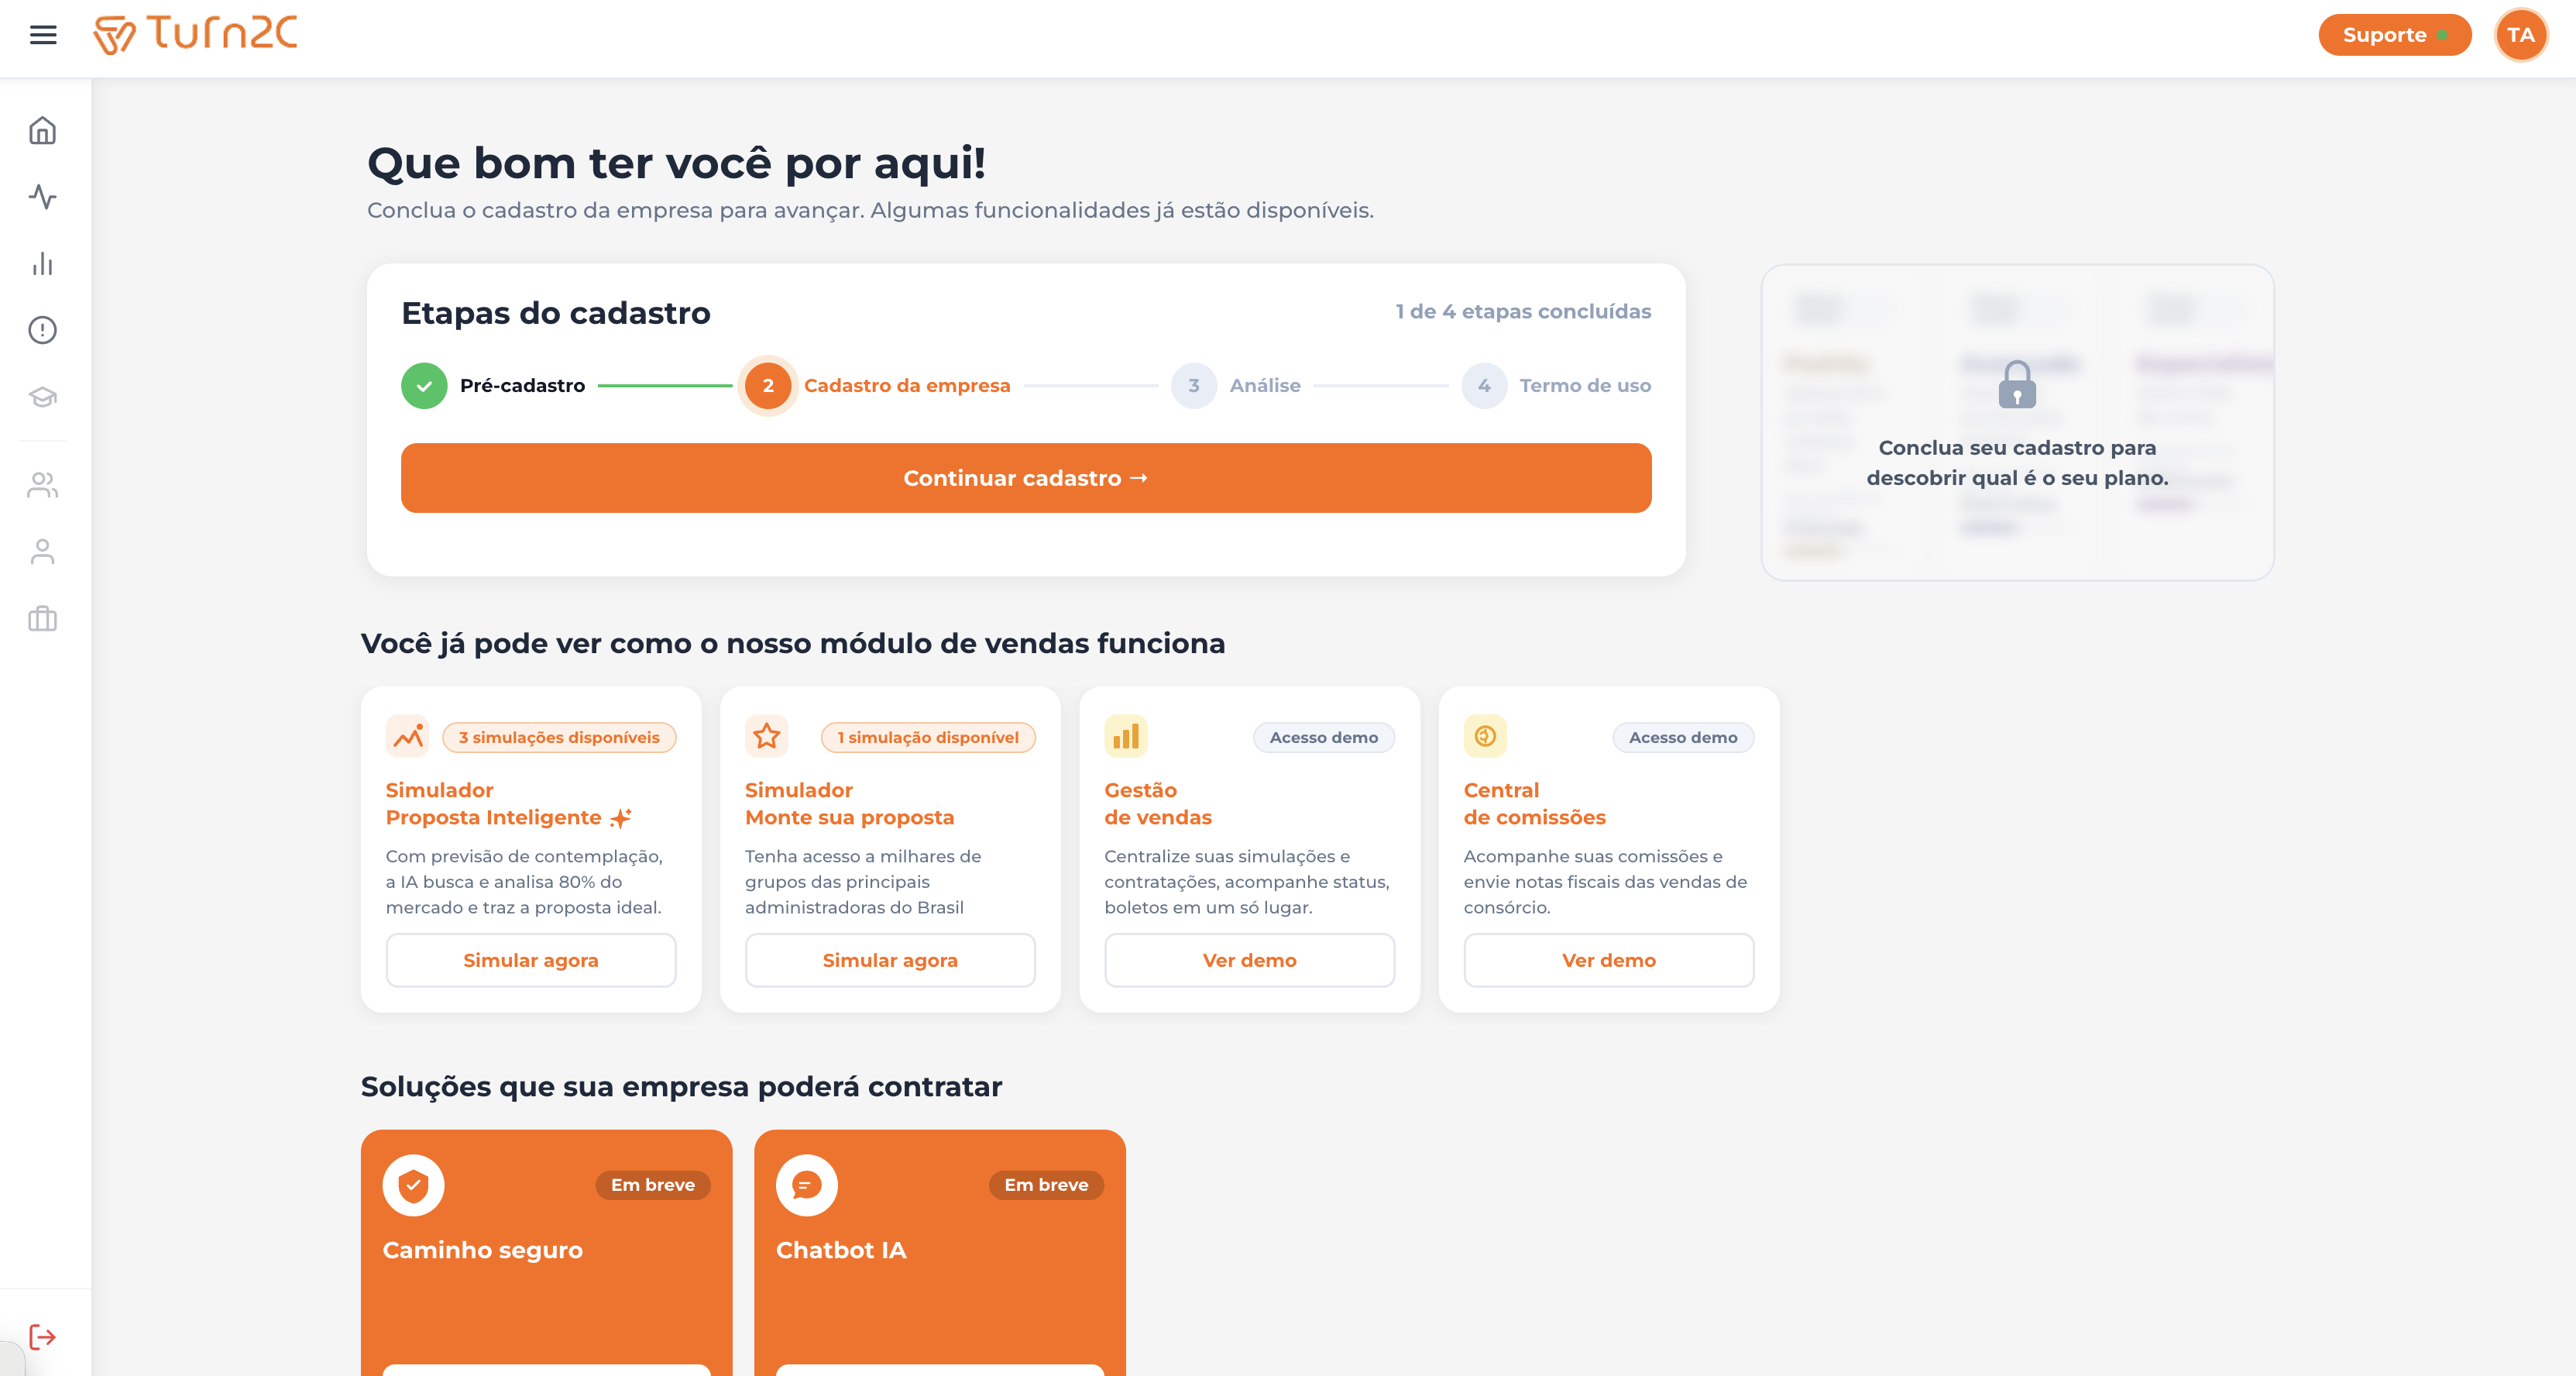
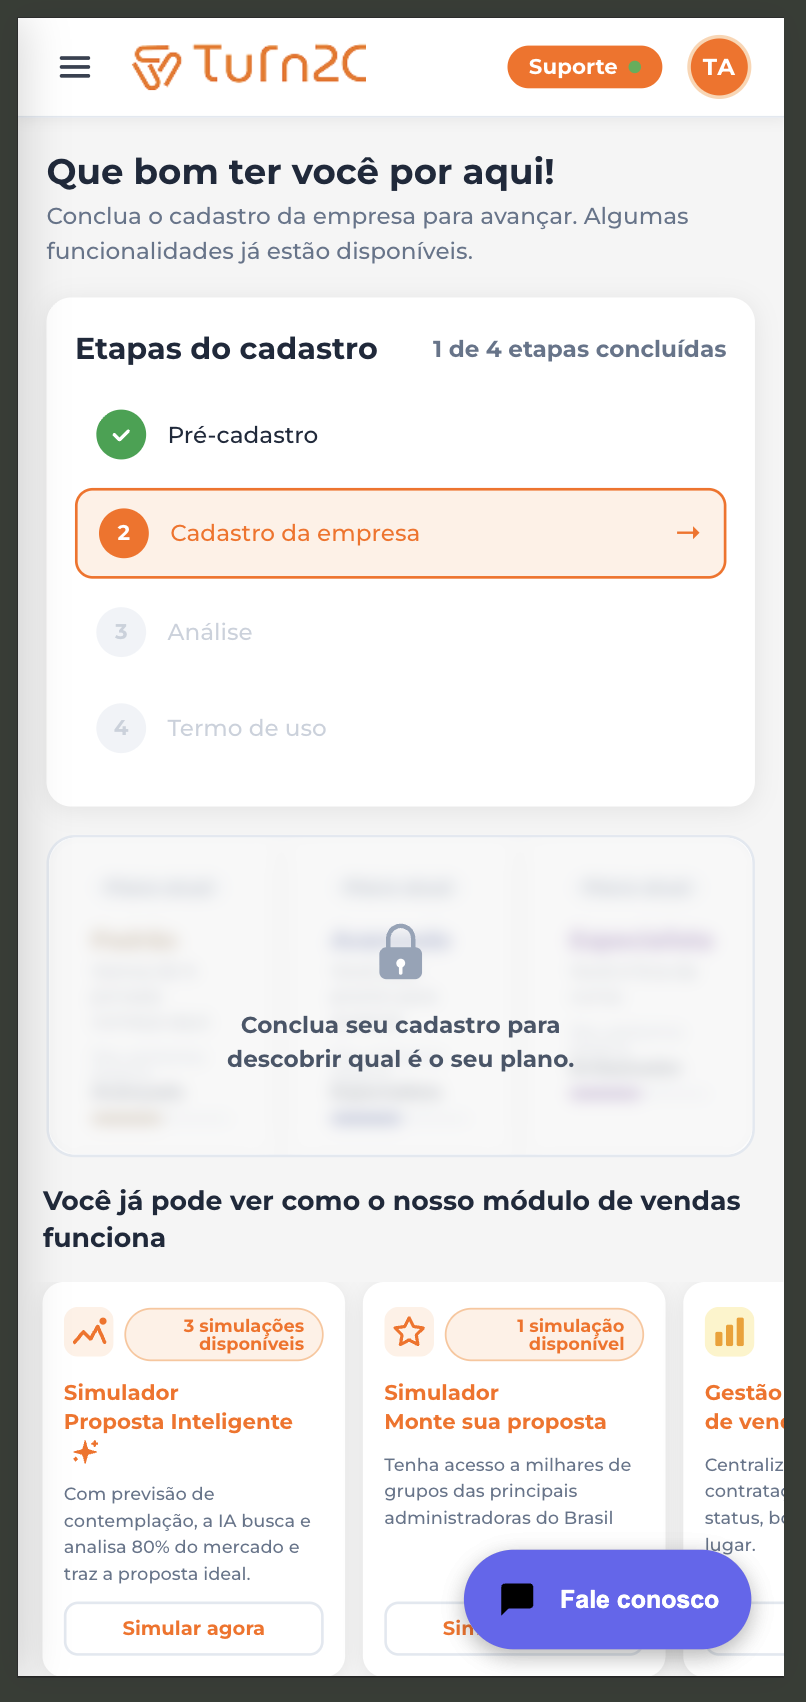
Real Turn2C platform home screen after pre-registration: 'Great to have you here' welcome message, four-step registration progress bar and sales simulators unlocked in demonstration mode

Real interface — the home screen that greets the partner right after pre-registration Fig. 00

Project brief
Project role Lead Product Designer responsible for discovery, UX strategy, journey architecture and experience coordination.
Core team Product Design, UI designer responsible for detailed design, Product Owner and Engineering.
Partner areas Marketing, Commercial, Legal, Support, CRM and Data.
Timeline Jan–Jul 2026 — from discovery to post-launch monitoring.
Product context Turn2C is a B2B platform that enables partner companies to offer consortium products — a widely used Brazilian installment-based purchasing model.
Scope End-to-end redesign of new partner onboarding and activation, including the external experience, internal operations, CRM integration and journey instrumentation.
My responsibilities Initiative proposal · stakeholder research, Hotjar and benchmarking · UX Wall synthesis · journey and state architecture · cross-team alignment · UI detailing direction · deployment monitoring · measurement and retrospective.
01 / 10 Tension

The problem

A seemingly small journey began affecting acquisition, qualification, risk and support.

Fields and documents were front-loaded; after submission, the partner had no clear sense of where they stood, what was missing or what would happen next.

Who goes through this journey
Primary user

Professional responsible for initiating the accreditation of a company interested in selling consortiums through Turn2C. May be an owner, salesperson, manager or operational lead — not always the company's legal representative.

Context

Arrives mainly through acquisition initiatives, usually on mobile, with varying levels of knowledge about consortiums, commercial structure and operational maturity.

Goal

Understand the platform's value, verify whether the model fits their operation and gain access to simulation and sales tools.

Journey conditions

Limited attention on mobile, value proposition still being built, business documents not always at hand, and the need to balance fast onboarding with qualification and legal compliance.

Commercial interest Profile qualification Platform exploration Company formalization Validation Activation to sell

The journey maps the transition from commercial prospect to enabled partner — not the registration of an end consumer.

The previous experience

The previous experience was visually organized, but front-loaded too much effort. Before understanding the platform's value, the prospect had to provide company data, contact details, address, digital presence and prepare to submit documents.

For eligible companies, this raised the cost of entry. At the same time, individuals also started the process even though the journey was designed for companies — meaning incompatibility was recognized too late.

The problem was not just the number of fields. It was the order in which eligibility, effort and value perception were presented.

The new journey separated three moments that were previously mixed: business eligibility, profile qualification and company formalization.

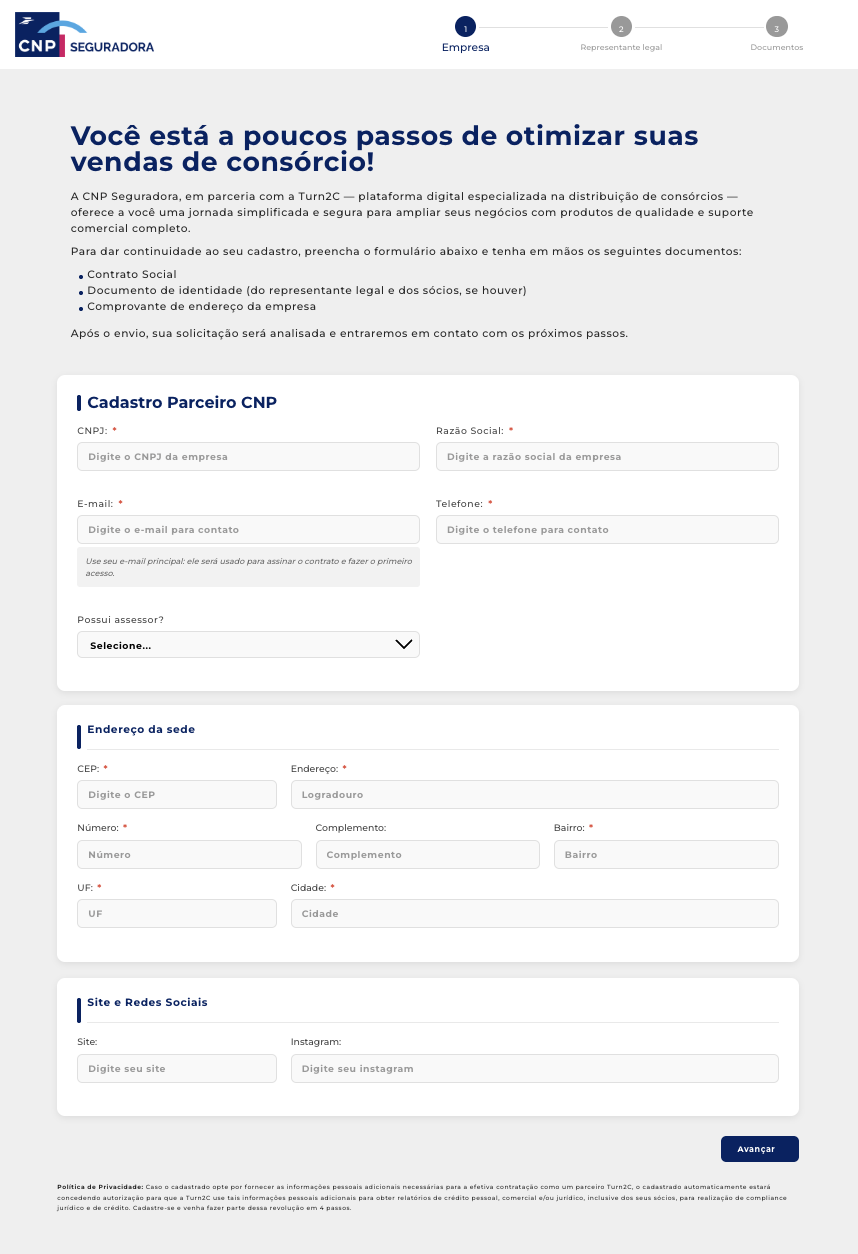
Desktop screen of the previous CNP Seguradora partner registration experience with Turn2C, showing an extensive first step with company data, contact info, address, website, social media and upfront document submission guidance.
  1. Too much effort before value perception
  2. Documents required at first contact
  3. Business eligibility not clearly stated
Fig. 01 — The previous experience in a partner operation Accreditation front-loaded company data, contact info, address, digital presence and document prep in the very first step, before the prospect experienced the product.
5

Affected areas. Marketing, Commercial, Legal, Support and Product each depended on different parts of the same journey.

Mobile

Primary context. The experience had to be born mobile-first, in a limited-attention context.

1

Journey, multiple bottlenecks. Unfit leads, rework, support calls and low predictability all coexisted in the same process.

The root of the problem
Structural failure 01

Business eligibility identified too late.

Structural failure 02

Too much effort front-loaded before value perception.

Structural failure 03

States and next steps were unclear.

“The user moves forward with uncertainty and the human team becomes the glue holding the process together.”

Author synthesis — diagnosis recorded in the discovery presentation (30/01/26)
02 / 10 Investigation

What we discovered

How we investigated
Approach

Multi-method discovery, combining behavioral evidence, experience analysis and operational knowledge from each team.

Participants

Four internal fronts: Marketing, Commercial, Legal and Support.

Period

January to March 2026.

Methods

Semi-structured interviews of 30–40 minutes, behavioral analysis with Hotjar, benchmarking, journey analysis and collaborative synthesis in a UX Wall.

Sources

Internal interviews, behavioral records, journey documentation, discovery materials and business rules.

Limitations

The total number of participants, interviews per area and Hotjar sessions analyzed were not consolidated in this case. The investigation relied heavily on internal stakeholders and should not be presented as a representative sample of end users.

The research cross-referenced what teams reported, what operations required and what behavior revealed.

I did not investigate only the interface. I investigated the system around it.

The research sought to surface conflicting rules, risks and success definitions across teams.

My role

I led the research, behavioral analysis with Hotjar and synthesis of cross-team conflicts in the UX Wall.

Marketing

Expectation, acquisition and drop-off at the start of the journey.

Commercial

Qualification, potential and rework in lead assessment.

Legal

Risk, compliance, documents and approval criteria.

Support

Questions, loops, pending items and lack of clarity about states.

The recurring pattern,
across every conversation

“Where am I in this process?”

“What's still missing?”

“What happens after I submit?”

Where the problem showed up in practice
/01

Approved leads that did not activate. The effort ended at approval, not at usage.

/02

Users stuck due to friction throughout the form.

/03

High volume of support tickets. Login, pending items and contract issues dominated support.

/04

Qualification and rework happening too late.

Research record — visible symptoms · 30/01/26 Acquisition flow · Analysis and proposals · UX

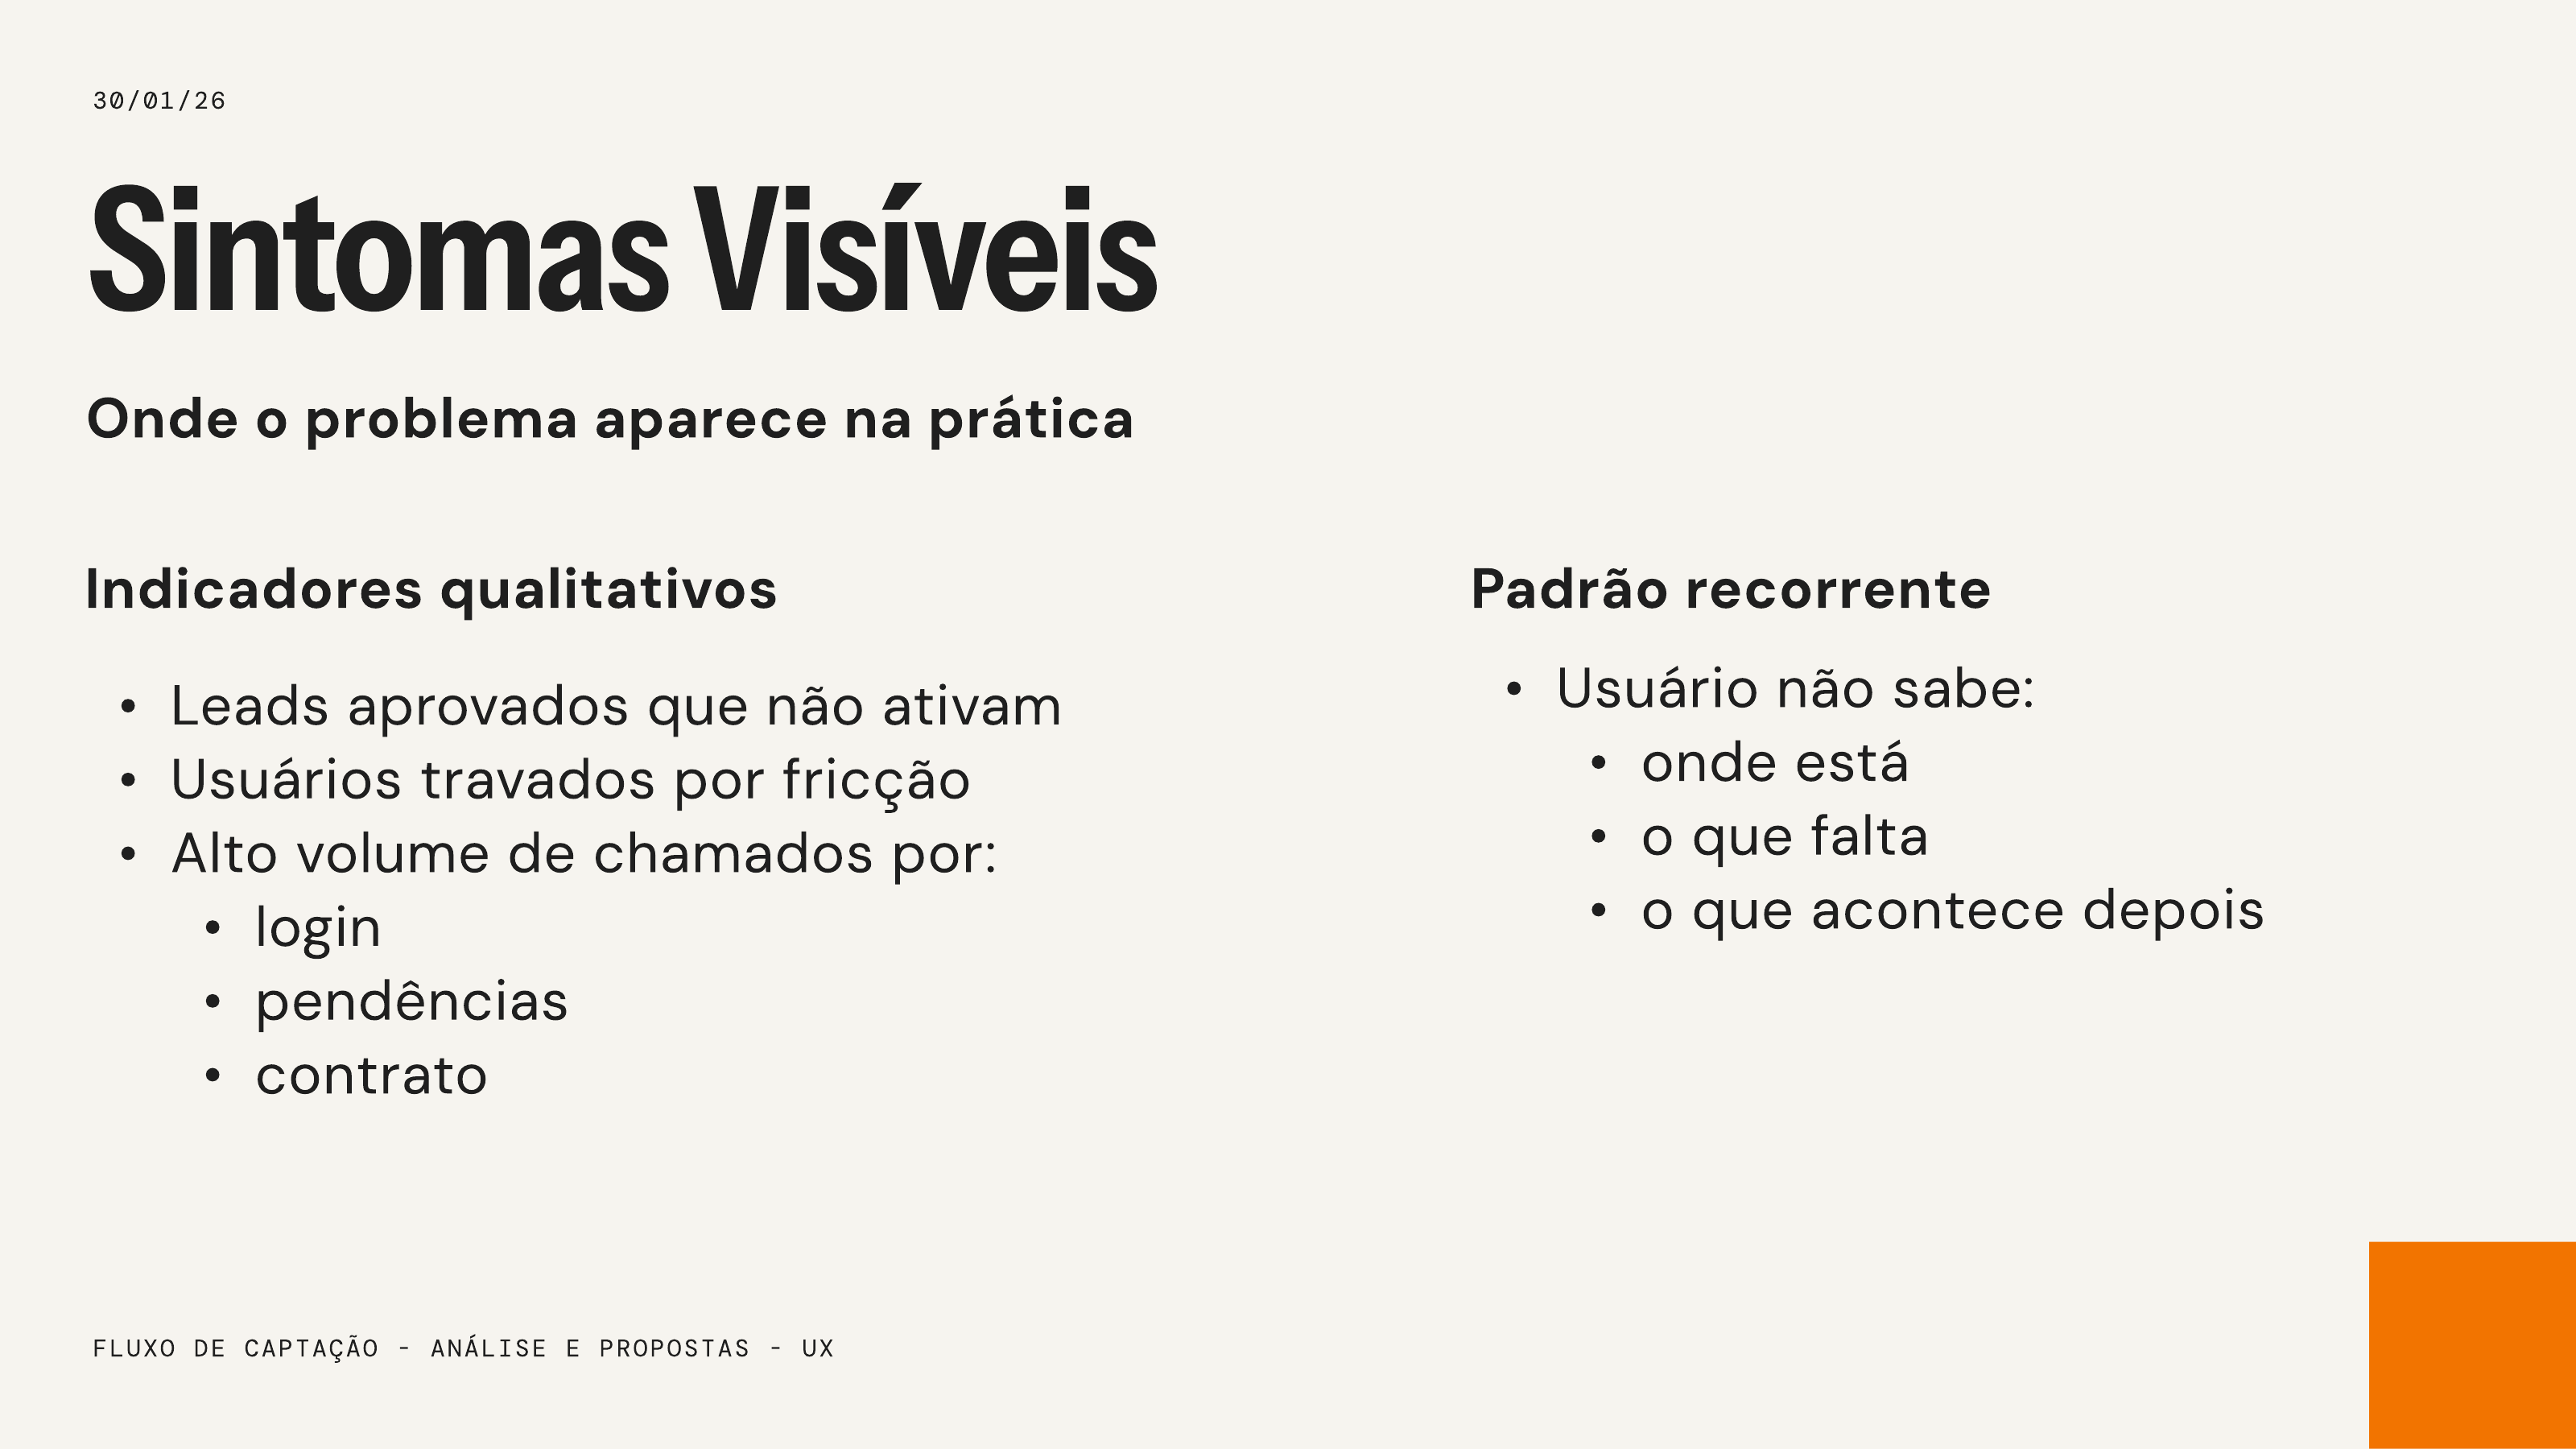
Original slide from the discovery presentation (30/01/26) — Visible Symptoms: Where the problem shows up in practice. Qualitative indicators: Approved leads that do not activate, Users stuck by friction, High volume of tickets for login, pending items and contract. Recurring pattern: User does not know where they are, what is missing and what happens next.
Fig. 02 — Visible Symptoms (30/01/26) Recurring symptoms and doubts identified during discovery.

Research record — initial cross-reading · 30/01/26 Acquisition flow · Analysis and proposals · UX

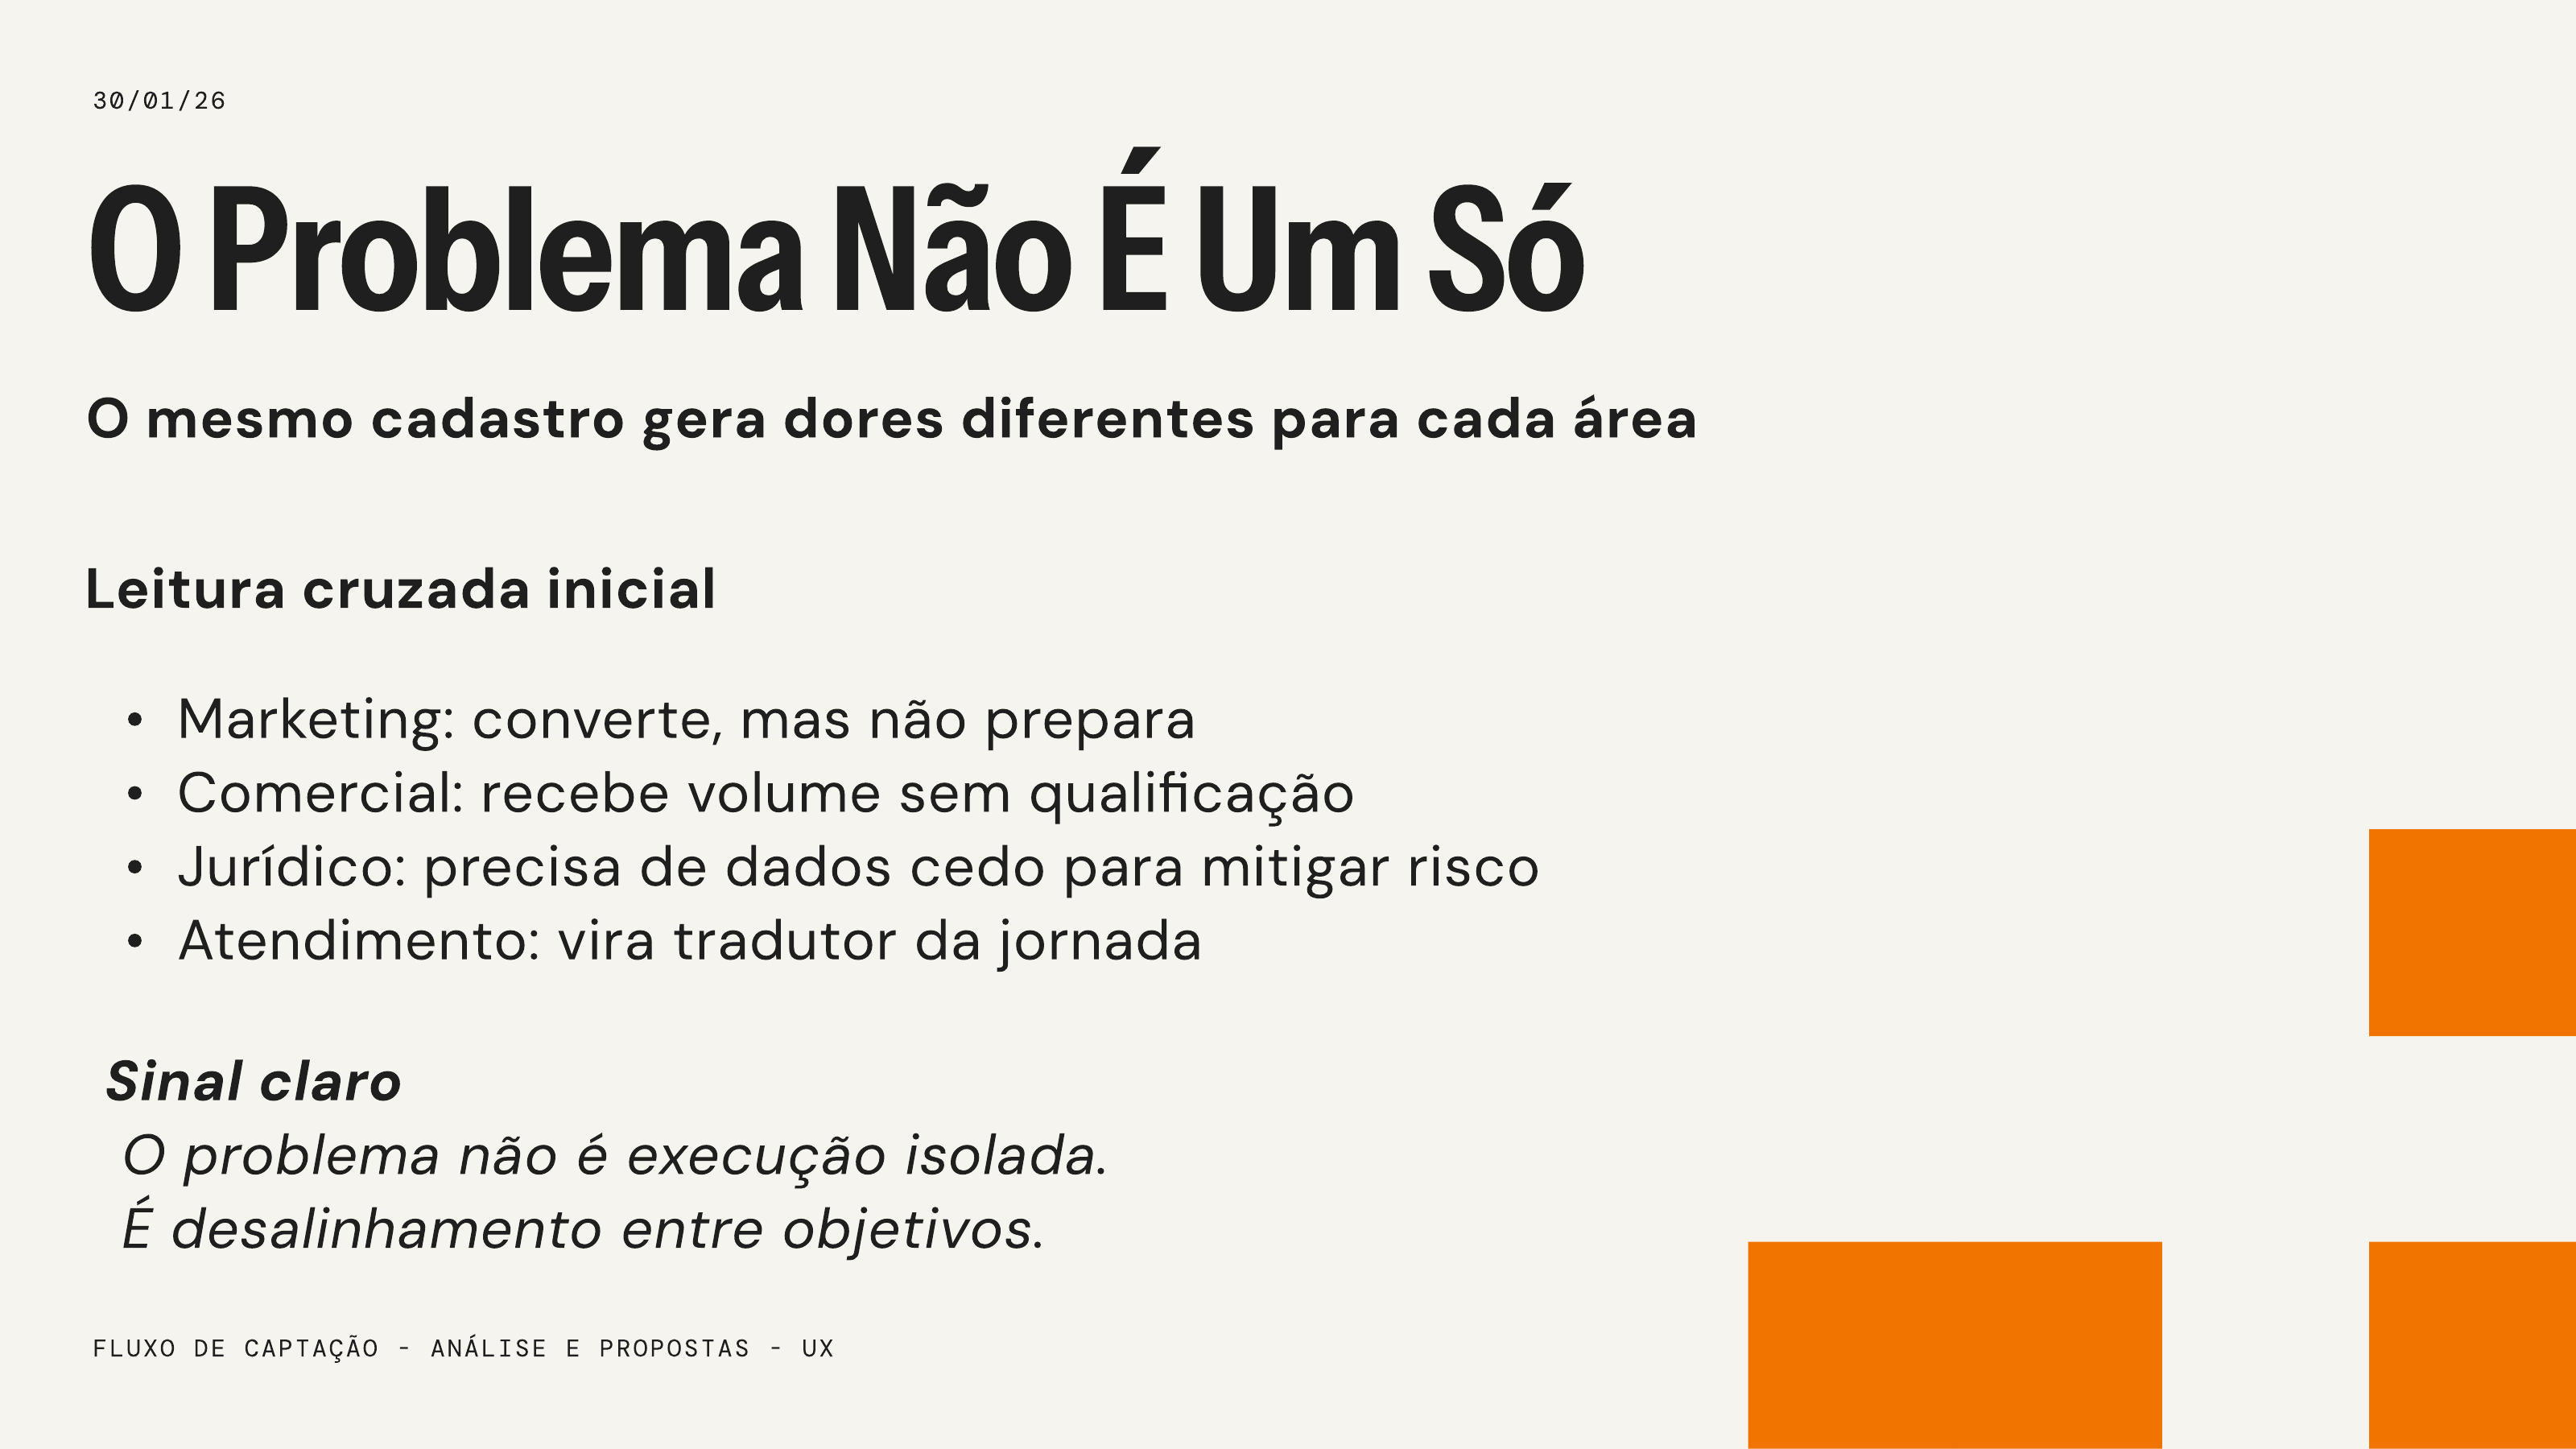
Original research slide — "The Problem Is Not Just One": the same registration generates different pain points for each team. Initial cross-reading: Marketing converts but does not prepare; Commercial receives volume without qualification; Legal needs data early to mitigate risk; Support becomes the journey's translator. Clear signal: the problem is not isolated execution, it is misalignment between objectives.
Fig. 03 — Initial cross-reading (30/01/26) Four teams, four readings of the same journey.
03 / 10 The turn

The shift in perspective

The project started as a registration redesign.

Research revealed that the real problem was demanding trust before delivering value.

The response was to redistribute effort and surface value earlier without removing the necessary controls.

Moment Before New journey
Starting Lengthy registration and documents before any benefit Lightweight pre-registration and progressive screening
Being qualified Potential assessed late by the Commercial team Qualification criteria built into the entry step
Discovering the product Access only after full approval Account created and modules available in demonstration
Submitting documents Complexity concentrated at a single moment Documents requested in context, with OCR and pre-fill
Tracking the process Silent waiting and reliance on external contacts State, deadline, pending items and next step visible
Internal tracking Information fragmented across teams and steps Origin, status and history unified in the internal environment
Evolving the product Bottlenecks perceived mainly through reports Instrumented milestones to locate progression and drop-off

This comparison represents the change in experience and operations logic. Initial quantitative results are presented in chapter 08.

P.01

Lightweight entry

Less friction to start, without removing qualification.

P.02

Value early

Exploration and demonstration before full approval.

P.03

Progressive complexity

Documents and validations at the appropriate moment.

P.04

Clear state

Track, correct and move forward without relying on ad-hoc messages.

04 / 10 Architecture

The new journey

The strategy was translated into eight internal steps, from pre-registration to full access.

Fig. 04 — The journey in motion Real navigation through the new journey: from pre-registration to the home that delivers value in demonstration mode, before full approval.

Eight steps for the product. Four milestones for the partner.

Internally, the product coordinates eight steps to support business rules, integrations, measurement and exception handling.

For the partner, this complexity appears as four action-oriented milestones.

The simplification happened in how the journey is communicated, not in the operational architecture.

  1. 01 Pre-Registration Lightweight entry
  2. 02 Screening Structured qualification
  3. 03 Account Creation Early access
  4. 04 Demo Value before approval
  5. 05 Company Registration Business data
  6. 06 Analysis Internal review
  7. 07 Awaiting Signature Digital contract
  8. 08 Finalized Active partner

Value: account and demonstration before approval.

Risk: validations preserved through states and rules.

Continuity: pending items and signature resolved within the flow.

One architecture, two levels of reading

What the partner sees
Pre-registration
Company
registration
Analysis
Signature
Unlocked after entry Account created + demonstration access
What the product coordinates
Pre-Registration Screening
Account Creation Demo Company Registration
Analysis
Awaiting Signature Finalized
My role

I connected experience, business rules and CRM into a single architecture.

05 / 10 The core of the case

Product decisions

Five changes to the experience logic. Each one connects a piece of discovery evidence to a structural change in the journey — none of them are just about screens.

Decision 01 / 05

Lightweight entry and smart screening

Source evidence

Individuals were starting a journey designed for companies. The Commercial team identified the mismatch only after entry and had to requalify leads late, creating unnecessary effort on both sides.

Product decision

Use the company tax ID (CNPJ) as the sole initial data point to confirm business eligibility before screening — keeping entry short and avoiding effort on a journey incompatible with individuals.

Risk or trade-off

Making the tax ID (CNPJ) the gateway could introduce a barrier: comprehension issues, typos, lookup errors or data unavailability could interrupt the journey before value perception — also blocking eligible companies through avoidable friction.

Validation metric

Pre-registration entry, typing start, CNPJ validation, failure reasons and progression to screening.
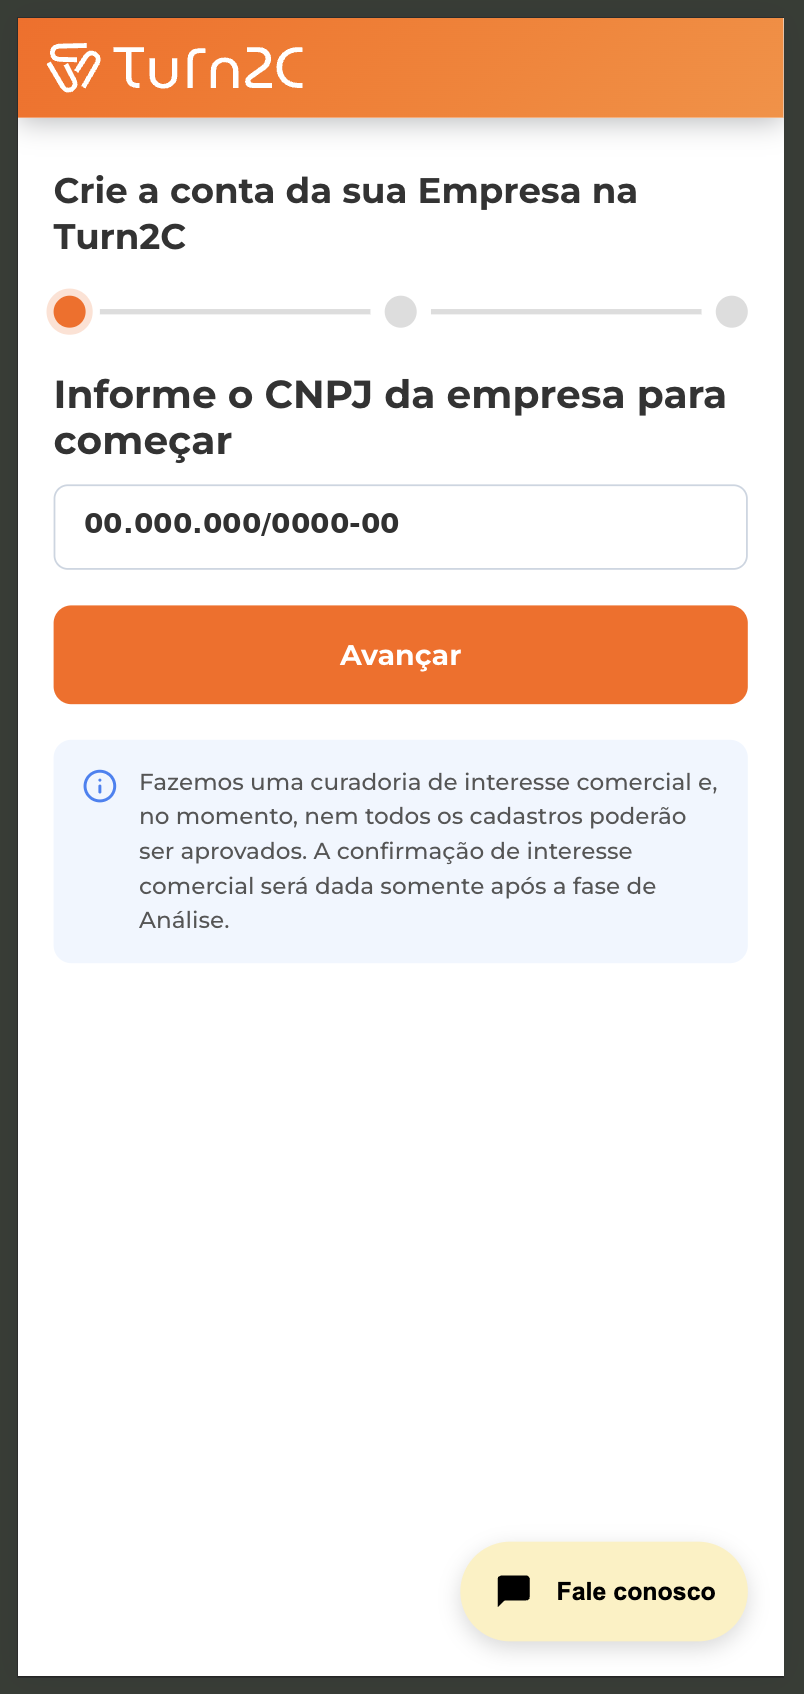
Real mobile screen of the B2B pre-registration: CNPJ field as the only initial data point, orange Turn2C header, 3-step progress bar and a note about commercial interest curation
  1. A single data point to begin
  2. Eligibility verified right at entry
Fig. 05 — Pre-registration
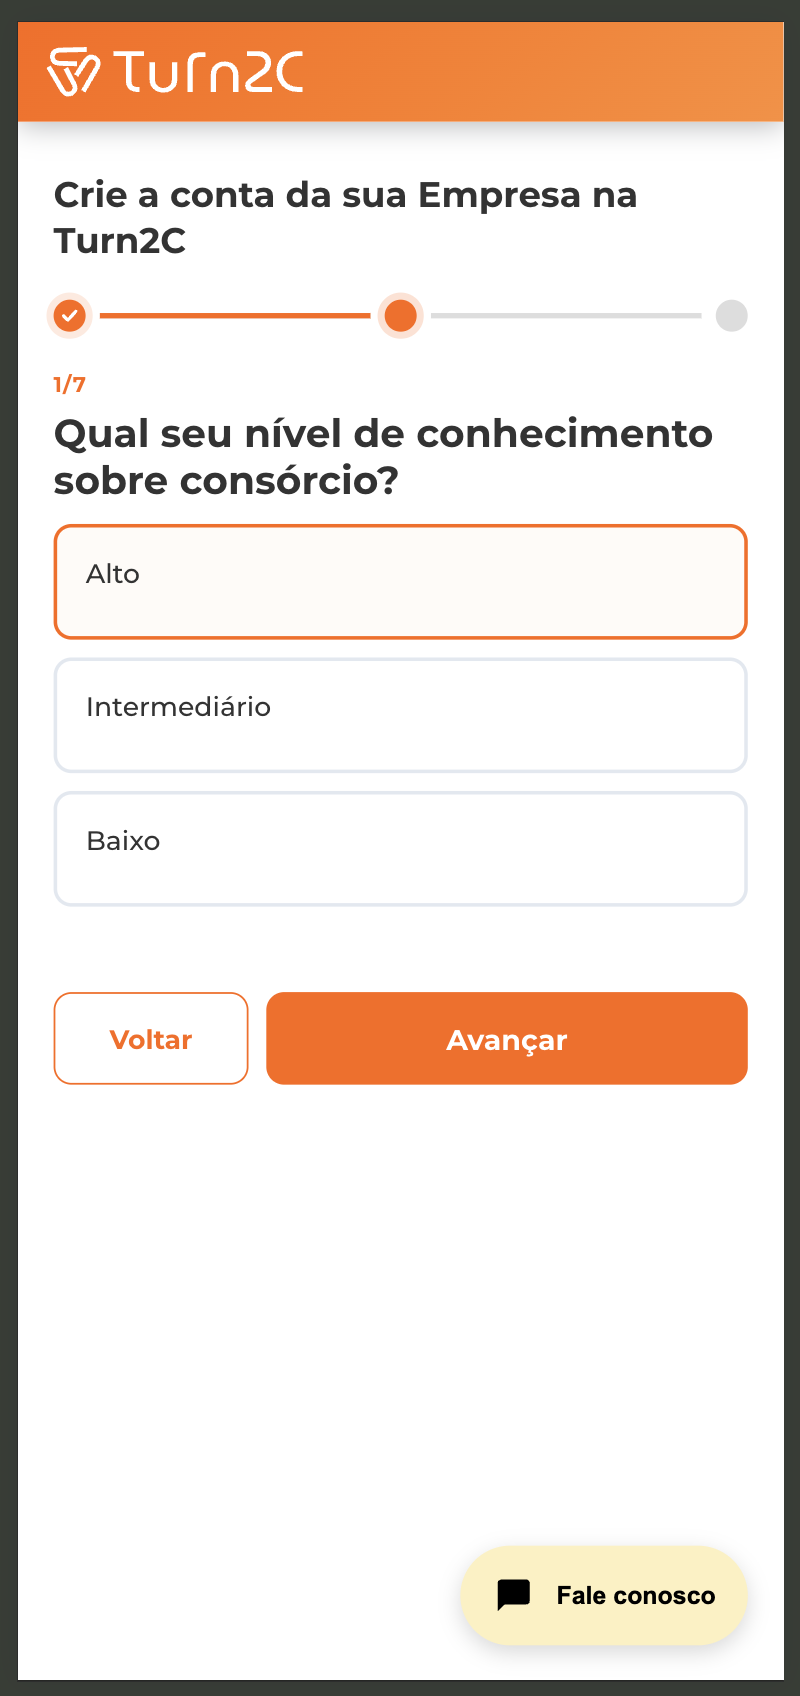
Real mobile screening screen: question 1 of 7 about consortium knowledge level, with High, Intermediate and Low options on selectable cards
  1. One decision at a time
  2. Seven questions, visible progression
Fig. 06 — Screening
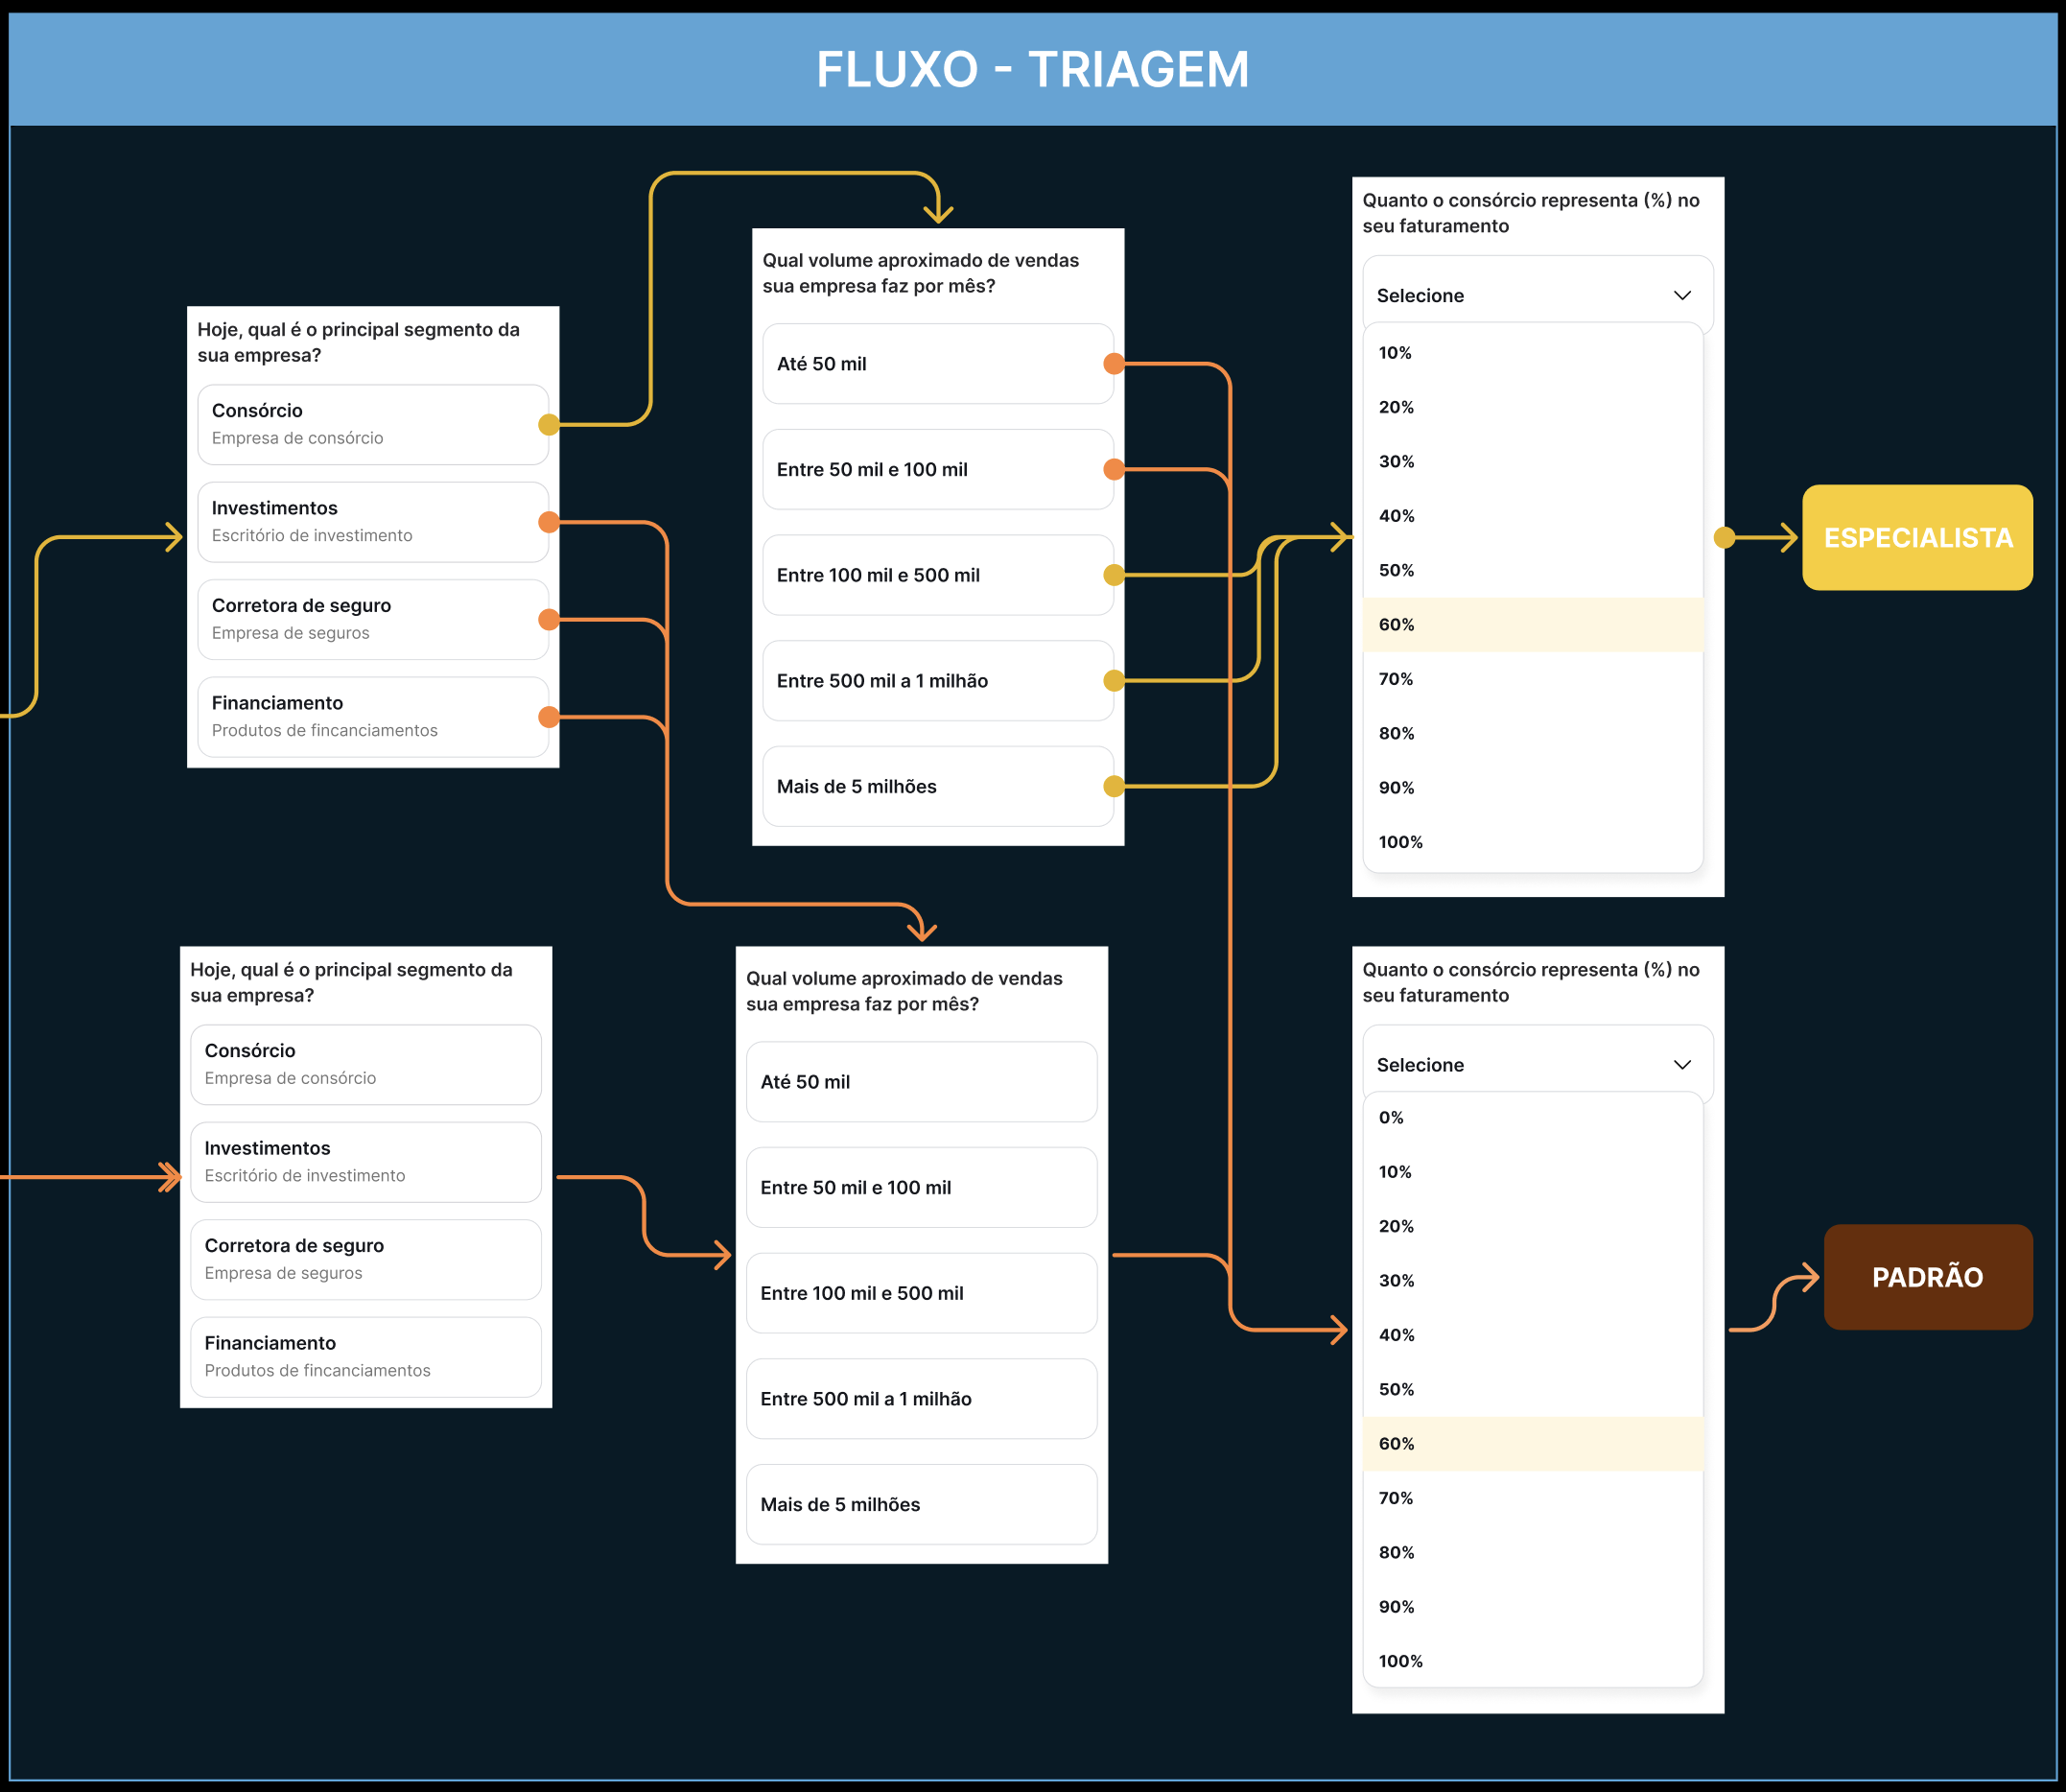
Screening flow: two paths — Specialist and Standard — with chained questions about segment, sales volume and consortium share of revenue
Fig. 07 — Screening logic Answers combine maturity, context and potential to guide follow-up.
What the screening needed to uncover

The screening turned criteria that the Commercial team previously investigated manually into structured signals from the very start of the journey.

Axis 01 Product familiarity
Consortium knowledge level
Seeks to understand

How much context and guidance the partner needs to get started.

Decision supported

Calibrate the onboarding level and introductory content.

Axis 02 Business fit
Company's main segment
Seeks to understand

How the company's current activity relates to consortium sales.

Decision supported

Interpret the profile without relying on prior experience as the sole indicator.

Axis 03 Commercial capacity
Approximate monthly sales volume
Seeks to understand

The current scale of the operation and its capacity to generate opportunities.

Decision supported

Size the potential and the need for commercial follow-up.

Axis 04 Consortium maturity
Consortium share of revenue
Seeks to understand

Whether consortium already represents a significant revenue stream or is still in the exploration phase.

Decision supported

Distinguish mature operations from partners who need more guidance.

Axis 05 Structure and complementary potential
Seeks to understand

The remaining questions complement the prospect's commercial and operational profile, preventing qualification from depending on a single indicator.

Decision supported

Complete the operational profile without reducing qualification to a single indicator.

Post-launch data did not indicate that the screening structure was the main internal barrier.

The Results chapter defines the cohort, period and denominators behind this reading.

The goal was not just to approve or reject. It was to understand maturity, fit and potential to tailor follow-up without requiring a full registration before that reading.
Observed result The main drop-off occurs before screening. Part of it may represent correct filtering of profiles without business eligibility; another part may stem from drop-off or friction in CNPJ validation. Current data does not yet separate these causes.
Decision 02 / 05

Create the account before approval

Account created. Partner exploring. Approval still in progress.

Source evidence

The partner had to complete most of the process before understanding the product.

Product decision

Create the account and unlock modules in demonstration mode while approval continues.

Risk or trade-off

Early access could generate expectations of full activation or expose restricted features.

Validation metric

Demonstration start, return to registration, completion and activation after approval.

Real mobile home screen after pre-registration: 'Great to have you here!' welcome message, 4-step ruler with Pre-registration complete and Company registration as the next step, and sales modules available in demonstration mode
  1. Value unlocked before approval
  2. Next step always visible
Fig. 08 — Home in demonstration mode Account created before full approval; modules accessible in demonstration mode.
Observed result 24 unique prospects started a demonstration between 01 and 25/07. The data does not yet prove impact on completion or activation.
Decision 03 / 05

Place complexity at the right moment

Source evidence

Documents and validations were required, but front-loaded before value perception.

Product decision

Distribute document collection and use OCR and pre-fill to reduce manual typing.

Risk or trade-off

Incorrect extractions could generate false confidence, discrepancies and rework.

Validation metric

Fill time, corrections, resubmissions, pending items and manual effort.

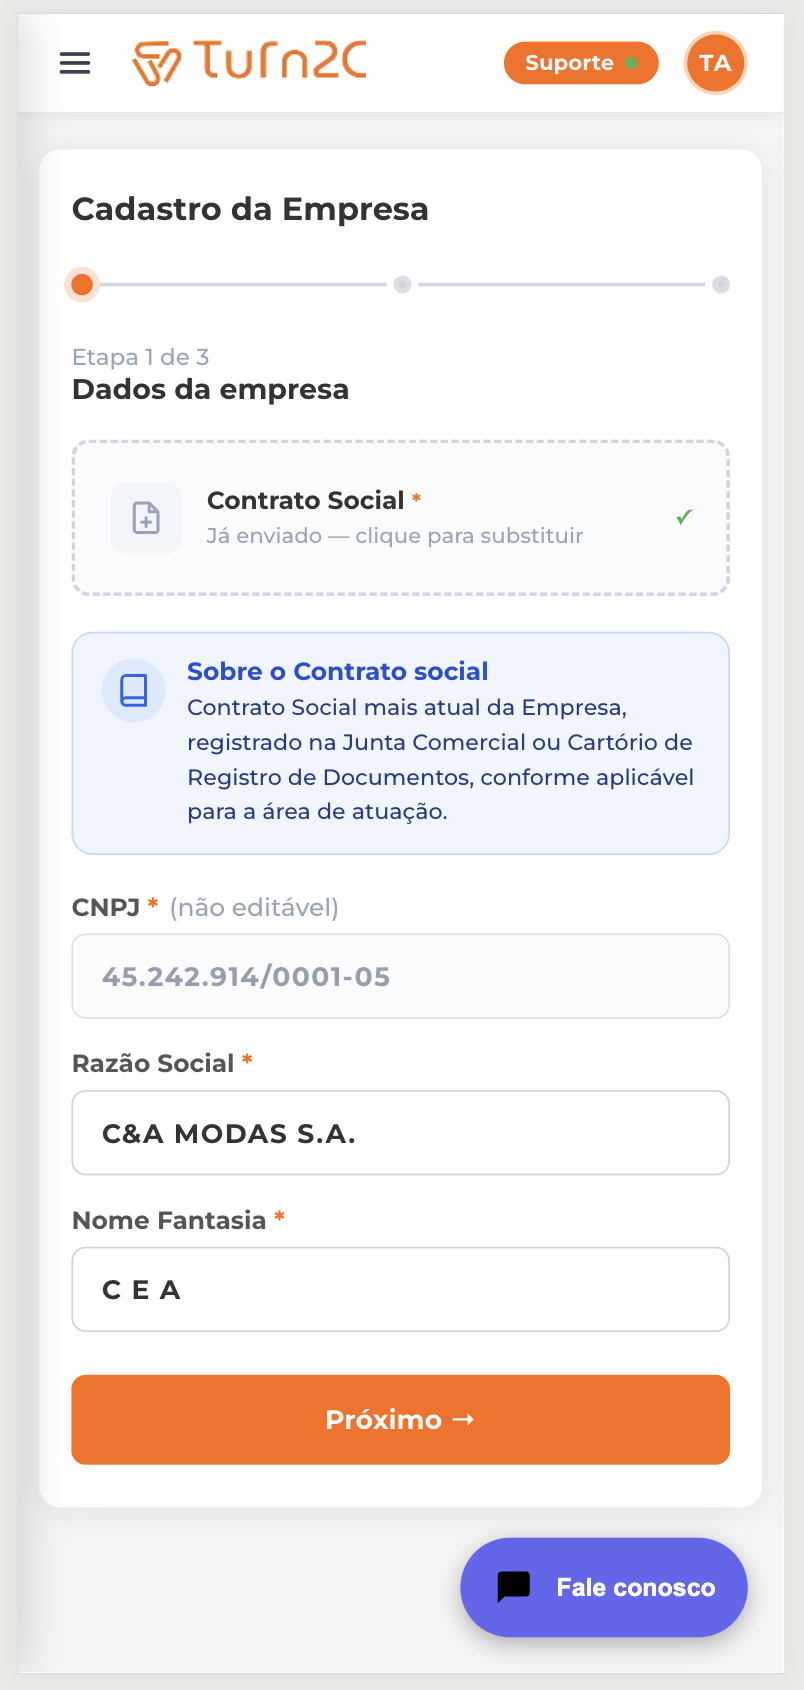
Real mobile company registration screen: articles of incorporation already uploaded with a checkmark, document guidance, pre-filled and non-editable tax ID (CNPJ), Company Name and Trade Name auto-filled
  1. OCR reduces manual typing
  2. Validated data stays protected
Fig. 09 — Company registration Articles of incorporation uploaded; tax ID, company name and trade name pre-filled via OCR.
Fig. 10 — The weight, at the right time Personal data form for the legal representative, with the content area intentionally blurred for privacy.
Observed result Capability implemented; impact on errors and rework not yet measured.
Decision 04 / 05

Turn anxiety into a visible state

Source evidence

Partners did not know where they stood, what was missing or what would happen next.

Product decision

Display macro-steps, state, deadline, pending items and next step in the interface.

Risk or trade-off

The visual simplification could diverge from internal states or create deadline expectations.

Validation metric

Status tickets, pending resolution, drop-off and perceived comprehension.

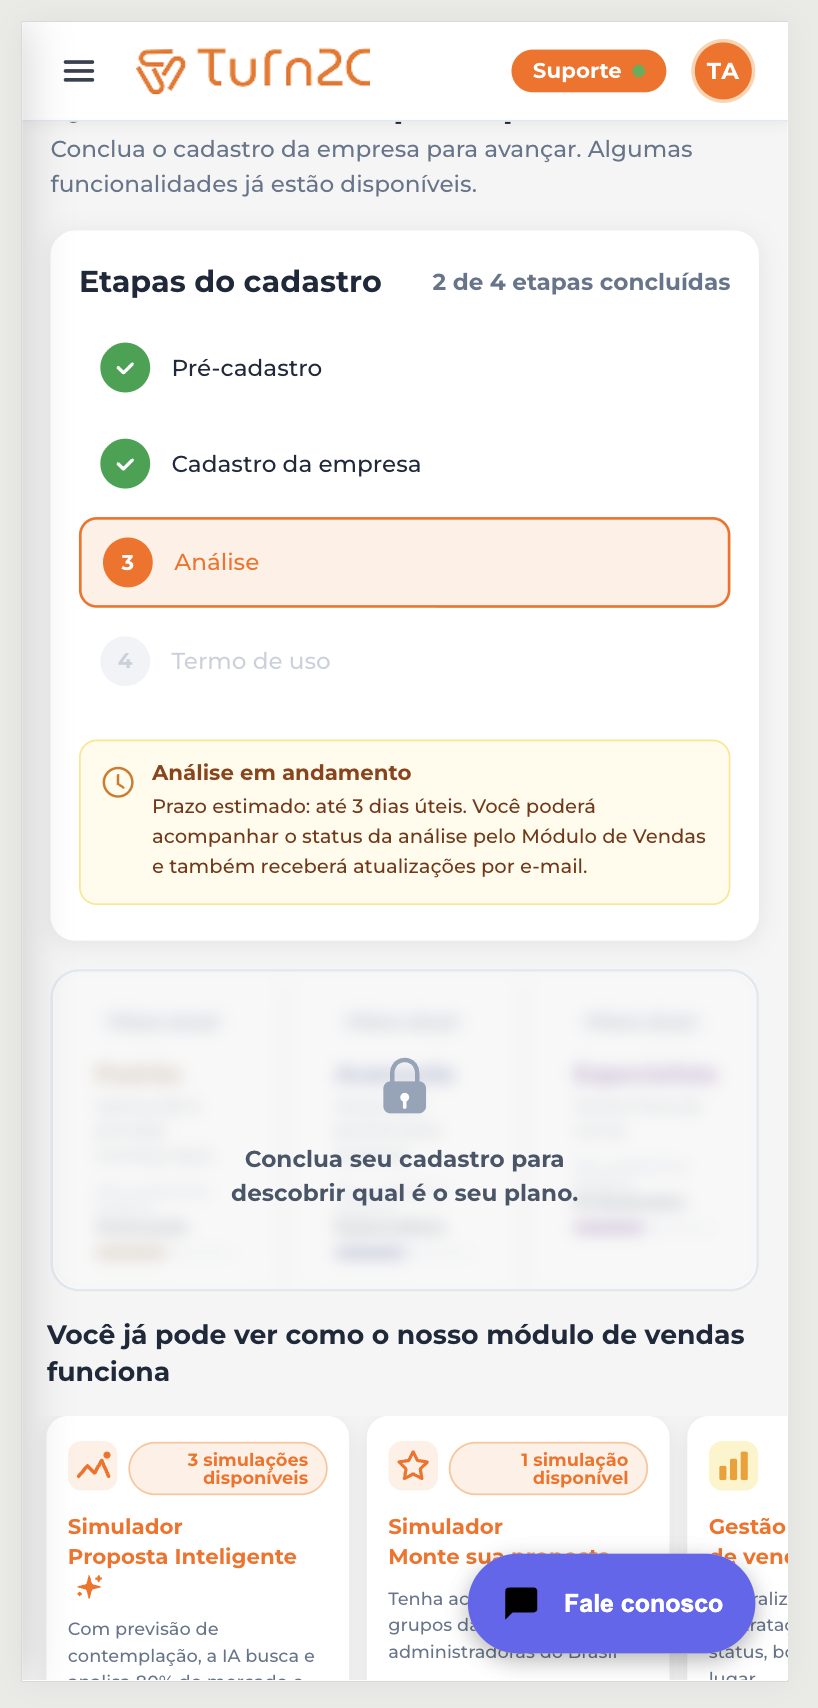
Real mobile home screen with analysis in progress: Pre-registration and Company registration complete, step 3 Analysis active, estimated deadline notice of up to 3 business days and product modules unlocked for exploration
  1. Deadline replaces silent waiting
  2. The journey continues during analysis
Fig. 11 — Analysis in progress State shown after registration submission: estimated deadline, pending items and next step visible.
Observed result States were deployed; no direct measurement of tickets, anxiety or comprehension yet.
Decision 05 / 05

Make the journey exist internally too

Source evidence

Teams tracked different parts of the same lead, with no clear continuity between origin, status and history.

Product decision

Integrate the journey into the CRM and create a shared internal view.

Risk or trade-off

Synchronization failures could produce divergent versions of the partner's state.

Validation metric

Record coverage, synchronization errors, SLA, lookup time and adoption by teams.

Sanitized internal CRM pipeline showing an 8-step registration process with the current position at Analysis, step 6 of 8
  1. Pipeline with 8 milestones — position and progress visible in real time
Fig. 12 — Internal CRM · Sanitized pipeline view Current state and registration progress centralized for operational teams. Lead identifiers were removed for privacy.
Observed result Origin, status and history became visible, and six milestones were instrumented. Productivity gains have not yet been measured.
06 / 10 Execution

From strategy to delivery

The challenge was preserving the coherence of the vision across discovery, design, CRM, Engineering and deployment.

Alignment

Turn perception into decision

Discovery shared with Marketing, Commercial, Legal and Product.

Definition

Define the journey logic

Experience principles, business rules and CRM in a single architecture.

Technical articulation

Handoff with vision preservation

Maintain coherence across discovery, design, CRM, QA and deployment.

Deployment

Execution conditions

Beta, acceptance criteria, training and contingency alternatives.

Fig. 13 — UX Wall · Customer Journey on the board Internal post recording the cross-team alignment session — prior to redesign decisions.
The central trade-off

Launching a significantly better journey without waiting for the entire organization to be ready for the new governance model.

07 / 10 Instrumentation

What became measurable

For the first time, the team knows where the drop-off is — not just that it exists.

M.01 Pre-registration
M.02 Screening
M.03 Company
M.04 Submitted
M.05 Approved
M.06 Contract

6 milestones tracked · July: first reliable period · Instrumentation active from 18/06/2026

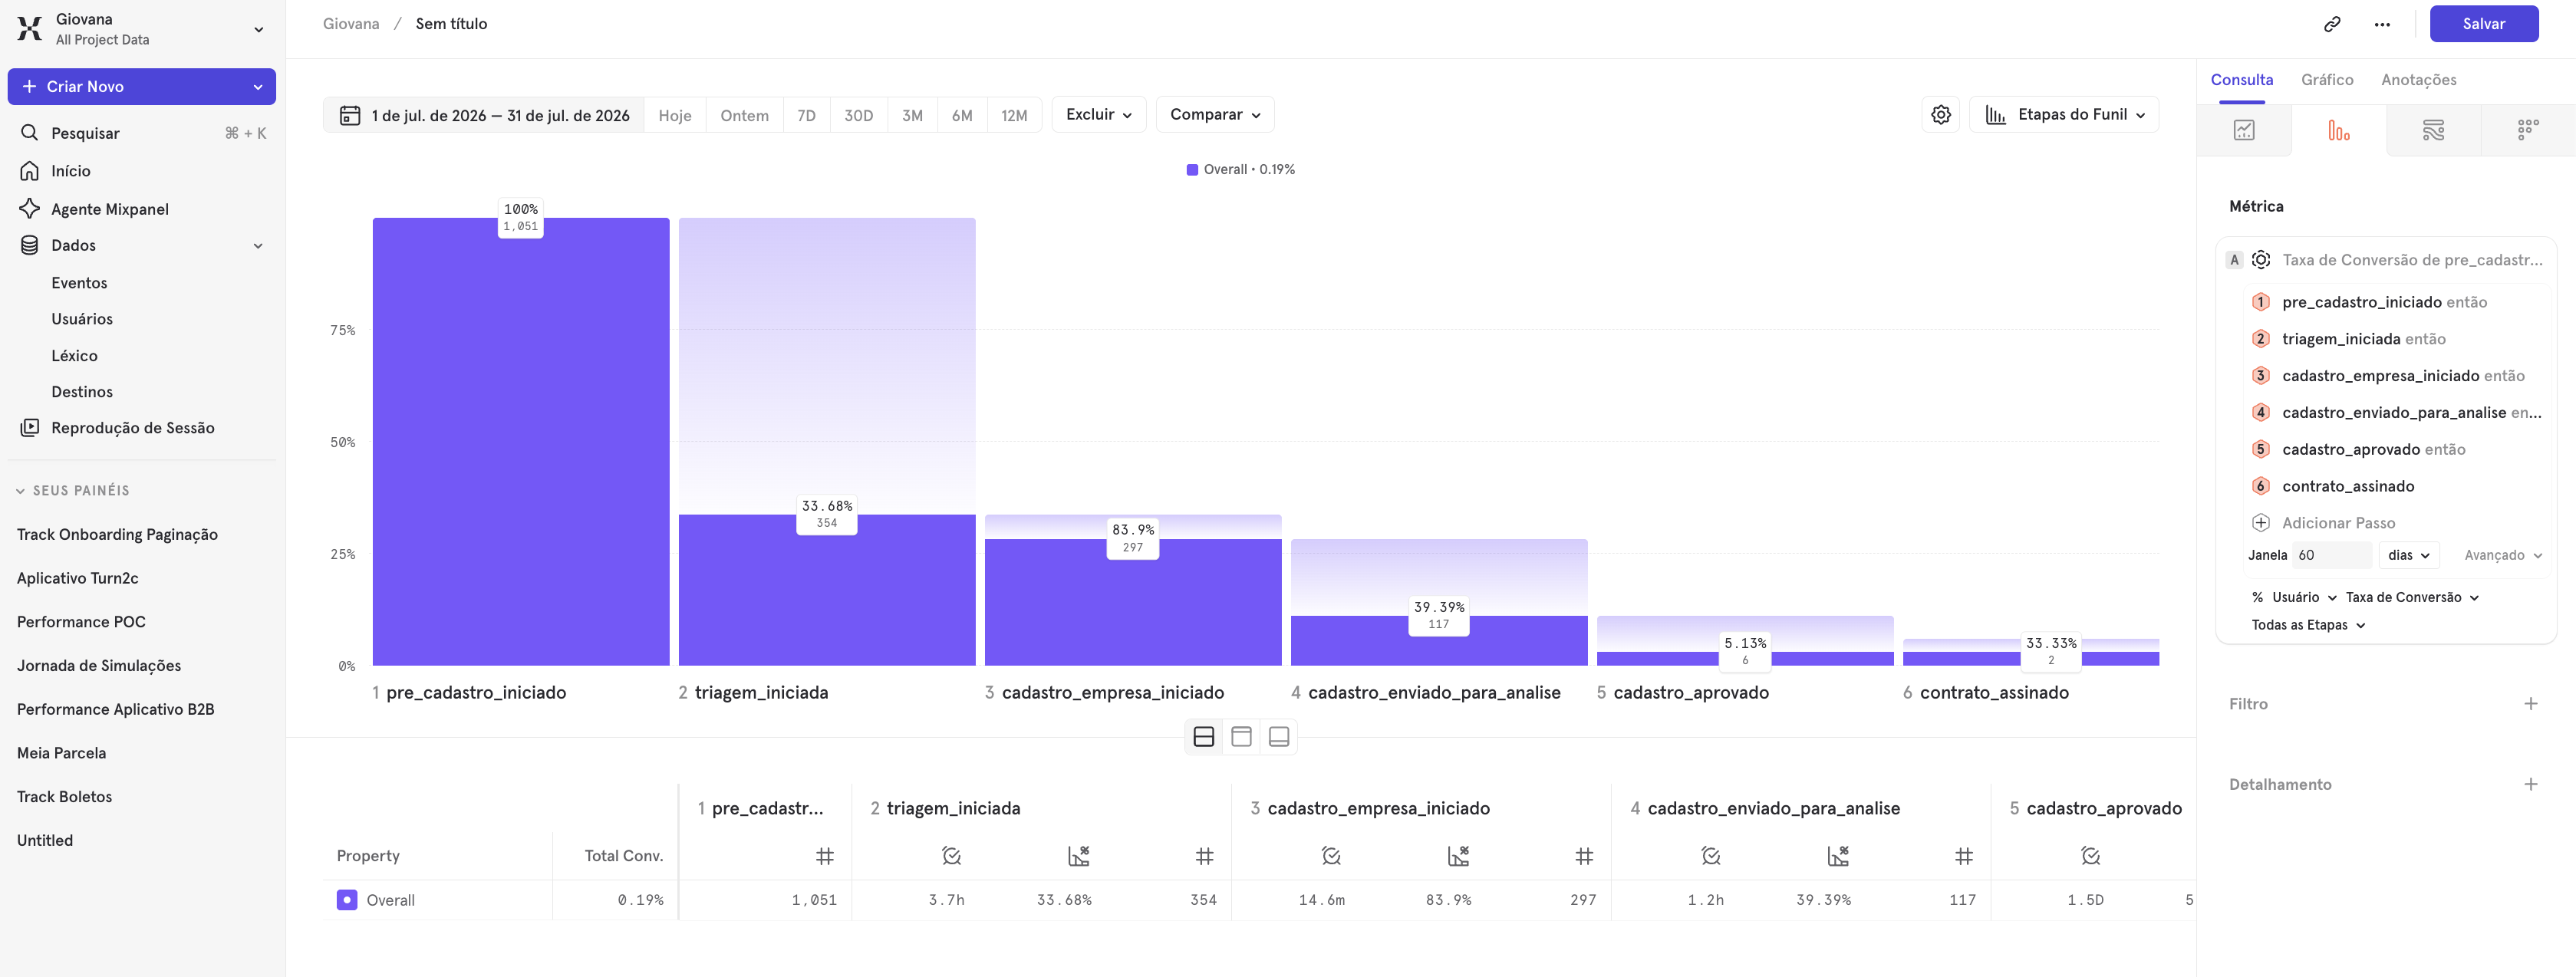
Six events instrumented in Mixpanel
pre_cadastro_iniciado triagem_iniciada cadastro_empresa_iniciado cadastro_enviado_para_analise cadastro_aprovado contrato_assinado
Mixpanel dashboard showing the conversion funnel with six instrumented events: pre_cadastro_iniciado (1,851), triagem_iniciada (55.68% / 354), cadastro_empresa_iniciado (81.9% / 297), cadastro_enviado_para_analise (39.39% / 117), cadastro_aprovado (33.33% / 5) and contrato_assinado — 60-day window, overall rate 0.19%
Fig. 14 — Milestones instrumented in Mixpanel Six events now represent journey progression, from the first pre-registration to the signed contract.
08 / 10 Climax

Results

The first data created a baseline, located the main drop-off and turned the next cycle into an objective investigation.

Methodological note. Main event tracking went into production around 18/06/2026. July represents the first reliable period for reading the new journey — June is not used as a baseline. Temporal correlation is not treated as causality. Some metrics still lack a comparable historical baseline; data volume in the final steps is insufficient for definitive conclusions.

Main metric · Period 01–25/07/2026 · unique users per step
of users who started screening completed all seven questions — 345 of 355 · unique users per step

The seven questions do not appear to be the main bottleneck.

The data does not currently support the hypothesis that the number of questions is the main cause of drop-off. Conversion between questions consistently stayed above 98.9% — no individual question generated a loss greater than 1.13 percentage points. The relevant bottleneck lies outside the screening, not within it.

Inside screening — seven questions

High internal conversion,
bottleneck located outside

Before screening · entry between 01 and 18/07, 7-day window per user

271 of 804 prospects reached screening — 33.7%. The largest drop-off appears in the interval between entry and the first question. The data locates where the drop-off occurs, but does not yet explain why.

Pre-registration entry
804
33.7% — 271 of 804
Screening
271
Inside screening — seven questions · período 01–25/07
Screening started
355
354/355 — 99.7%
Question 1
354
353/354 — 99.7%
Question 2
353
349/353 — 98,9%
Question 3
349
348/349 — 99.7%
Question 4
348
347/348 — 99.7%
Question 5
347
346/347 — 99.7%
Question 6
346
345/346 — 99.7%
Question 7 / Completed
345
97.2% completion · 01–25/07 · unique users per step

The largest observed drop-off occurs before screening, especially at the CNPJ validation step. At this point, drop-off does not necessarily indicate failure: part of it may represent the product correctly blocking a journey incompatible with individuals. The analytical challenge is separating correct filtering from avoidable friction.

Funnel diagnosis · Entry between 01 and 18/07, 7-day observation window per user
66.3% did not reach screening

533 of 804 cohort prospects.

Methodological notes

The cohort includes prospects whose first pre-registration occurred between 01 and 18/07/2026. Each user's behavior was tracked in the 7 days following their entry — since the cohort closes on 18/07, data is complete through 25/07. June was not used as a baseline — instrumentation went into production around 18/06/2026.

Low sample in the approval and contract steps. In the overall July funnel: 6 approved and 2 contracts. Not detailed in the 7-day cohort.

Top-of-funnel growth cannot be attributed solely to the redesign — seasonality, acquisition and commercial volume were not isolated.

The exact trigger for pre_cadastro_iniciado was not directly verified in the code. Intermediate events between entry and screening still need to be validated with the same cohort and window before explaining where the drop-off occurs.

Progression data — July

Reached submission within seven days. 89 of 804 cohort prospects reached submission for analysis. Limitation: no comparable historical baseline · Entry 01–18/07, 7-day window per user

Unique partners started a demonstration · 01–25/07. Event demo_iniciada · outside the main funnel · rate not calculated over pre-registration

Measurement legacy

What we are now
able to measure

Indicators the project now enables tracking. These do not yet have consolidated results — they represent the evolution of the organization's measurement capability, not achievements already reached.

Time to activationDays between pre-registration and active partner
Step conversionProgression from each step to the next
Drop-off by stepWhere and how much is lost at each journey point
Operational effortTime and internal touches per processed registration
ReworkErrors, returns and corrections per step
SLADeadline compliance per internal process
Conversion by channelPerformance of each traffic source
Activation qualityCompleteness and validity of submitted data
Commercial impactRelationship between activation and effective operation
How to read these results
Delivered
  • New pre-registration journey in production
  • Structured screening with early qualification
  • Account created and demonstration unlocked before approval
  • 8-step pipeline instrumented in CRM
  • Six critical milestones tracked in Mixpanel for the first time
  • Unified internal environment for all operational teams
Evidenced by data
  • High screening completion once started (screening analysis above)
  • Conversion between questions always above 98.9%
  • Main drop-off located before screening in the entry cohort
  • The drop-off is not inside the seven questions
Under investigation
  • Ratio between correct filtering and avoidable friction before screening
  • Isolated impact of the redesign — seasonality and acquisition not controlled
  • Operational productivity gain — not yet measured
  • Impact on rework, errors and SLA
  • Behavior of subsequent cohorts for comparison

Since the launch is recent, the case separates what was delivered, what already shows up in the data and what remains as a hypothesis. Temporal correlation is not treated as causality.

Next product cycle

Instrumentation did not close the project. It turned a generic drop-off into an investigable problem.

Baseline

Use the July entry cohort above as the first comparison point.

Cycle objective

Increase the progression of eligible companies to screening, preserving the block of incompatible profiles.

Guardrail

Preserve the high internal screening completion documented above.

The data does not support reducing the seven questions. Once started, screening shows conversion above 98.9% between questions.

Main hypotheses
Hypothesis 01 Eligibility versus friction
Hypothesis

Part of the drop-off represents individuals without business eligibility; another part may represent eligible companies blocked by error, data unavailability, a lookup failure or friction in the CNPJ field.

Next action

Instrument failure reason, document type provided, lookup error and drop-off; cross the data with Hotjar recordings, device, channel and campaign.

Success evidence

Estimate the ratio between correct filtering and avoidable friction and identify a specific intervention for eligible companies.

Hypothesis 02 Clarity of continuity and benefit
Hypothesis

Some users may not understand that a quick screening exists or what benefit will be unlocked upon completing it.

Next action

Test a communication that previews the number of questions, duration and demonstration access.

Success evidence

Increase in progression to screening without a drop in internal completion.

Hypothesis 03 Technical friction or variation by source
Hypothesis

CNPJ validation, performance, device or traffic quality may concentrate the drop-off.

Next action

Instrument errors and loading; cross progression by channel, campaign, browser and device; review Hotjar recordings.

Success evidence

Identification of a specific segment or event that explains a relevant part of the drop-off.

Instrumentation schema for the interval
Pre-registration viewed CNPJ started CNPJ valid CTA triggered Lookup completed Screening loaded First question answered

The next step is not to simplify screening — it converts. It is to separate correct filtering from avoidable friction for eligible companies.

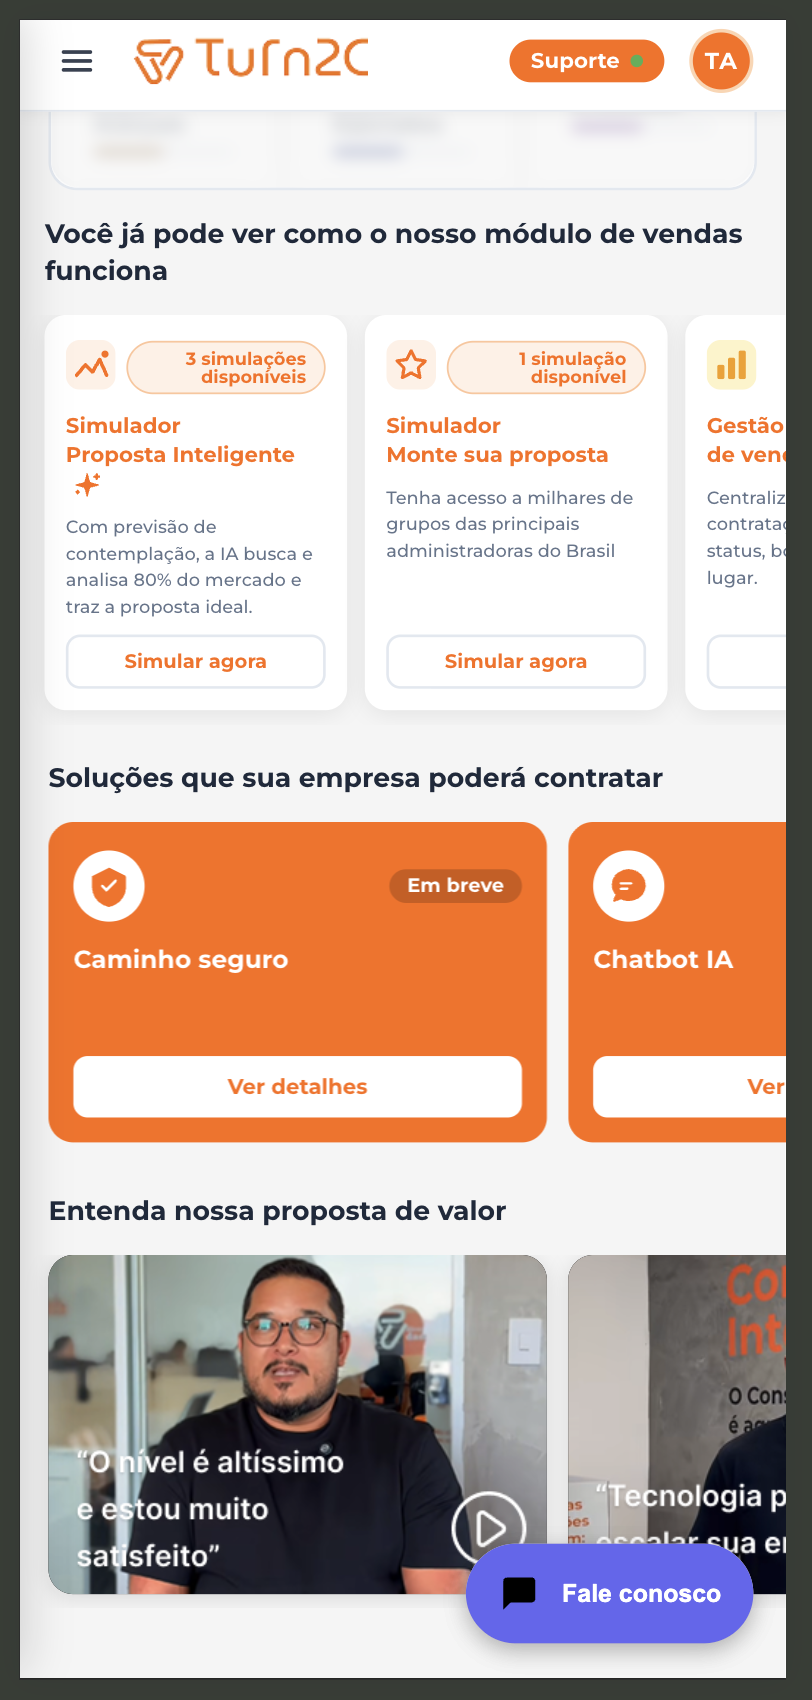
Mobile home screen showing sales modules available for exploration: Smart Proposal Simulator, Build your proposal Simulator, and Solutions section with Safe path and AI Chatbot
Fig. 15 — Home in demonstration mode Sales modules and simulators available for exploration before full activation.
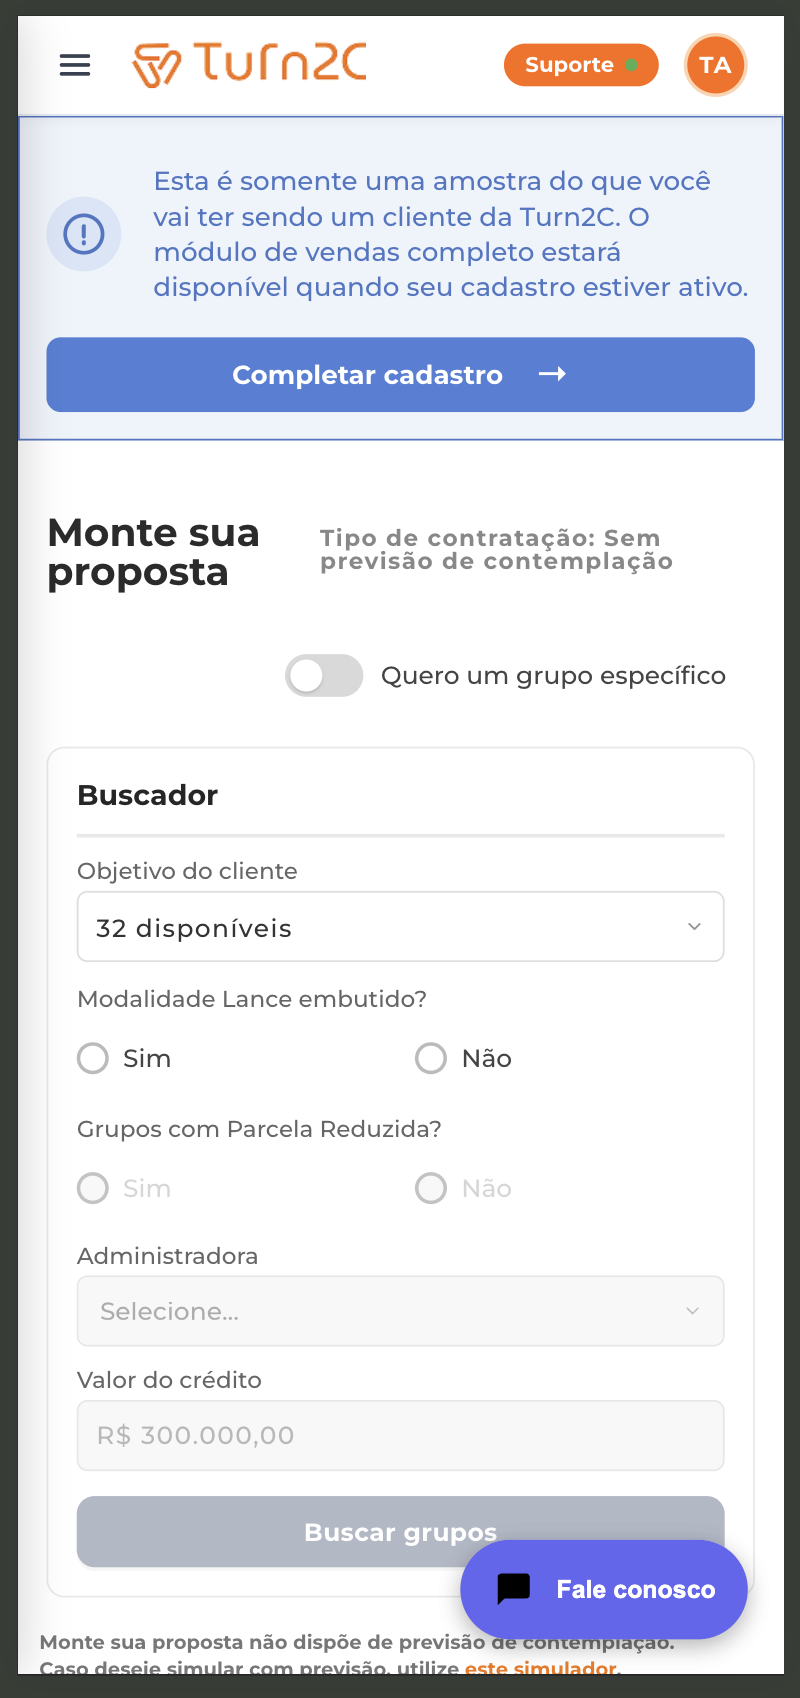
Mobile screen of the Build your proposal Simulator in demonstration mode: group search with objective, modality, administrator and credit value fields, with a CTA to complete registration
Fig. 16 — Build your proposal Simulator Group search with objective, modality and credit value filters, accessible in demonstration mode.
09 / 10 Learning

Governance and legacy

The go-live revealed a second problem: governance.

The deployment created tension between teams. The response was to turn the conflict into organizational learning, without looking for blame.

My role

I led the retrospective after the launch, connecting individual perceptions, patterns and responsibilities.

The response — 4Ls retrospective
  1. R.01
    Space to diverge

    Perceptions recorded without attributing blame.

  2. R.02
    Theme consolidation

    Individual reports converted into shared patterns.

  3. R.03
    Voting and prioritization

    Immediate response separated from what goes into the next cycles.

  4. R.04
    Roles and responsibilities

    Who decides, validates, executes, approves and communicates.

  5. R.05
    Action plan

    Learning converted into a model for future projects.

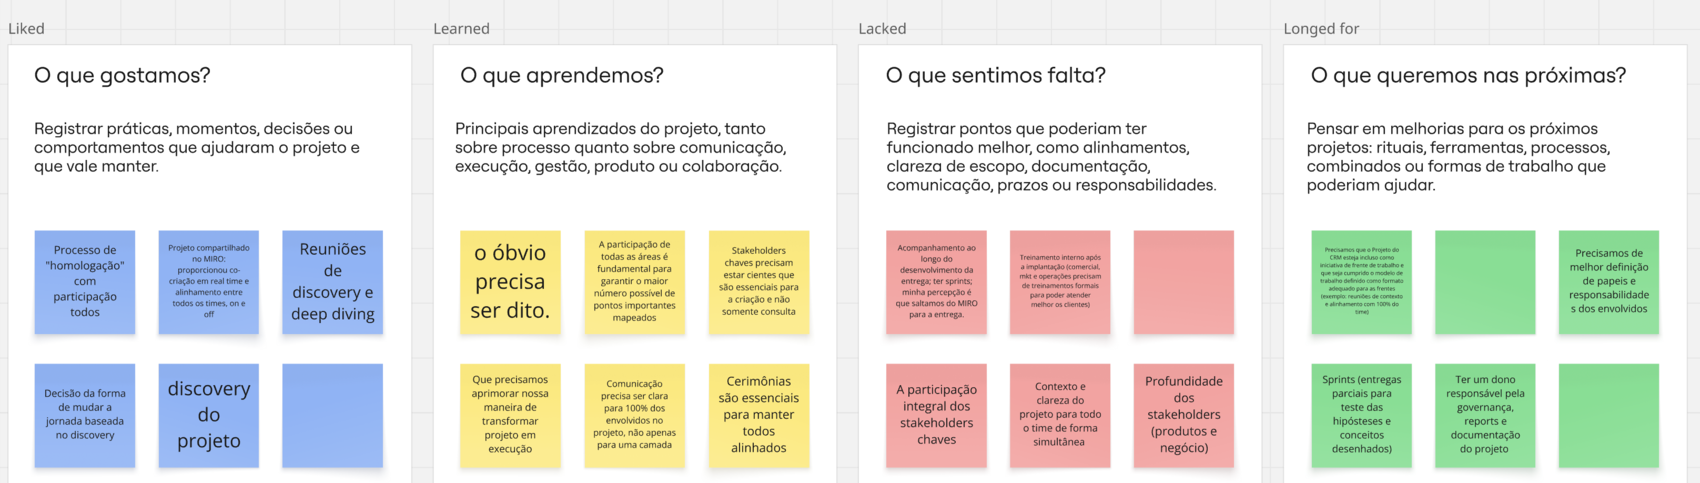
Real digital 4Ls retrospective board with four sticky-note columns — Liked: 'What did we like?', Learned: 'What did we learn?', Lacked: 'What did we miss?' and Longed for: 'What do we want next time?' — with team notes on discovery, stakeholder involvement, communication, ceremonies, roles and governance
Fig. 17 — 4Ls Retrospective Individual perceptions, shared patterns, responsibilities and actions for the next cycles.

A coordinator does not prevent every crisis. They create context for the team to learn and work better after it.

The stance adopted in the project
What the project left behind
  1. L.01
    Formal front

    Multidisciplinary team around a common goal.

  2. L.02
    Stakeholders from start to finish

    Decision, validation, sign-off and deployment.

  3. L.03
    Clear roles

    Explicit responsibilities to decide, execute and communicate.

  4. L.04
    Controlled rollout

    Beta, acceptance criteria, training and contingency.

  5. L.05
    Post-delivery measurement

    Data, heat maps and continuous improvement.

10 / 10 Epilogue

Closing

The greatest result was not launching a new journey.

It was creating a foundation for it to evolve continuously — with research, cross-team collaboration and real behavioral data.

Research Direction Solution Measurement Learning